. 1997 Dec 1;17(23):9194-203.
doi: 10.1523/JNEUROSCI.17-23-09194.1997.

A short-range signal restricts cell movement between telencephalic proliferative zones

Affiliations

A short-range signal restricts cell movement between telencephalic proliferative zones

C Neyt et al. J Neurosci. .

Abstract

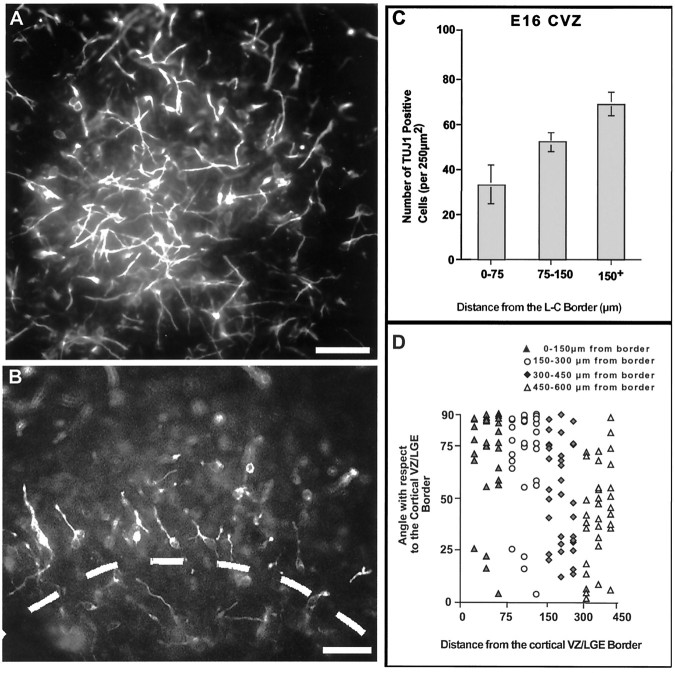
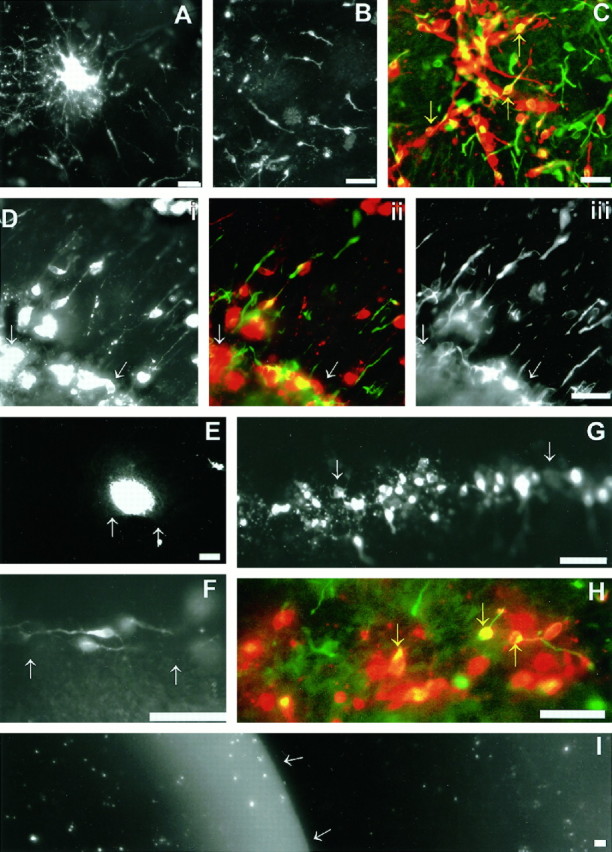
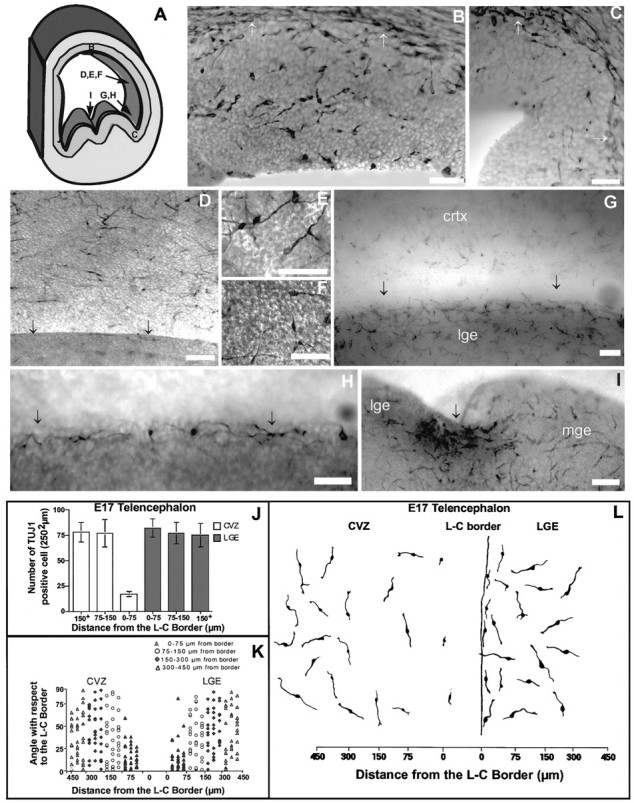
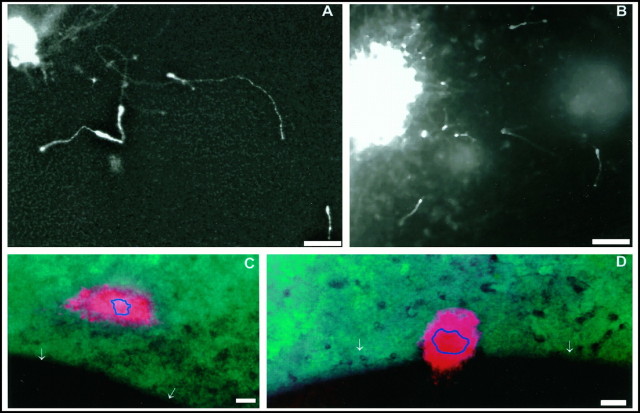
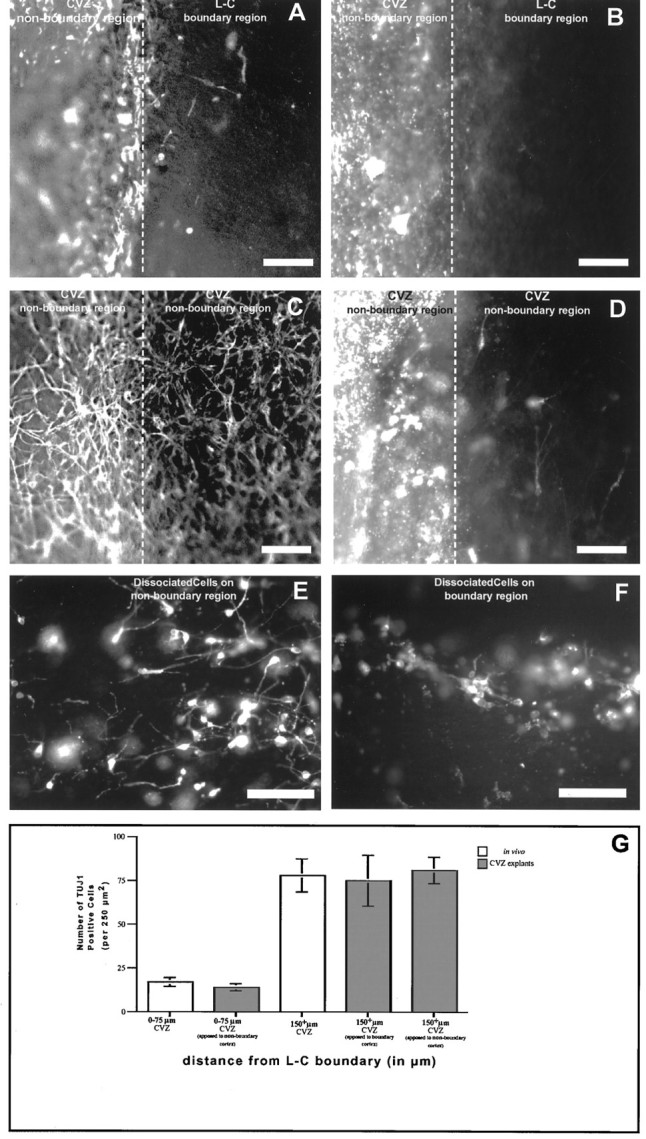
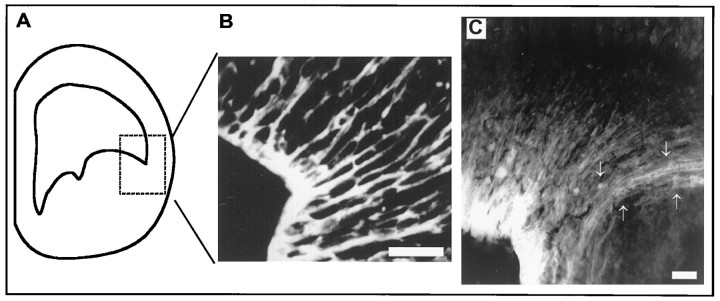
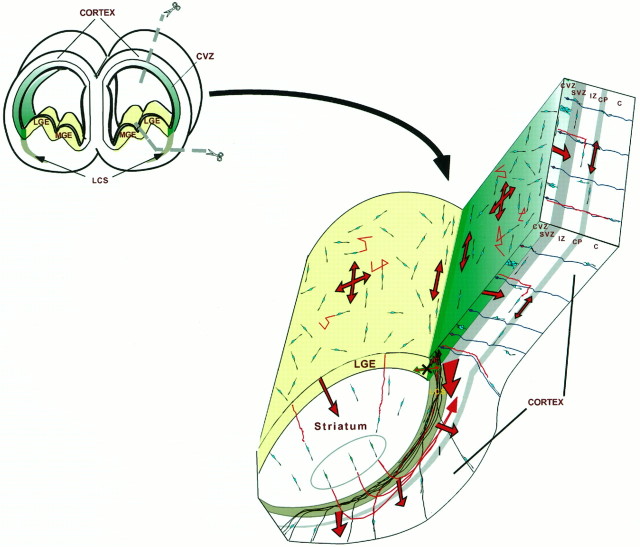
During telencephalic development, a boundary develops that restricts cell movement between the dorsal cortical and basal striatal proliferative zones. In this study, the appearance of this boundary and the mechanism by which cell movement is restricted were examined through a number of approaches. The general pattern of neuronal dispersion was examined both with an early neuronal marker and through the focal application of DiI to telencephalic explants. Both methods revealed that, although tangential neuronal dispersion is present throughout much of the telencephalon, it is restricted within the boundary region separating dorsal and ventral telencephalic proliferative zones. To examine the cellular mechanism underlying this boundary restriction, dissociated cells from the striatum were placed within both areas of the boundary, where dispersion is limited, and areas within the cortex, where significant cellular dispersion occurs. Cells placed within the boundary region remain round and extend only thin processes, whereas progenitors placed onto the cortical ventricular zone away from this boundary are able to migrate extensively. This suggests that the boundary inhibits directly the migration of cells. To examine whether the signal inhibiting dispersion within the boundary region acts as a long- or short-range cue, we apposed explants of boundary and nonboundary regions in vitro. Within these explants we found that migration was neither inhibited in nonboundary regions nor induced in boundary regions. This suggests that the boundary between dorsal and ventral telencephalon isolates these respective environments through either a contact-dependent or a short-range diffusible mechanism.


Figures

Fig. 1.
Fig. 1.
TUJ1-positive neurons within the E16 CVZ. A, Region of the CVZ >150 μm from the L–C border, in a flat-mounted preparation (the area is similar to that in Fig. 2DF, as seen in Fig.2A). Note that large numbers of randomly oriented TUJ1 cells are present within this region at E16. B, Area adjacent to the L–C border, where TUJ1-positive cells are preferentially aligned perpendicular to the border. This photomicrograph is also a flat-mounted preparation (in this case, the area shown is similar to that in Fig.2G,H, as seen in Fig.2A). C, Quantitation of the number of TUJ1 cells within various CVZ regions as a function of distance from the L–C border. Note that fewer TUJ1 cells were observed in regions near the border (0–75) region compared with areas away from this boundary (≥150) (F(2,12) = 10.32; p < 0.05). Also note that at E16, in the 0–75 border region, approximately three times the number of TUJ1-positive cells are observed compared with that seen 1 d later (i.e., E17) within the same region (compare Fig.2J). Data were collected by measuring five 250 μm2 areas (in five different preparations, for each of the zones quantified). D, Orientation of cells relative to the L–C border as a function of distance to from the L–C boundary. In this graph, cells oriented at 0° correspond to cells parallel to the L–C boundary. In contrast, cells oriented at 90° are positioned orthogonal to the L–C boundary. Each pointon this graph represents the orientation of a single neuron relative to the L–C boundary. Note that cells in the 0–75 group are preferentially oriented at 90°, i.e., orthogonal, to the L–C border, compared with 1 d later when they are preferentially oriented at 0°, i.e., parallel, to the L–C boundary (Fig.2J) [F(3,128) = 10.34; where the only significant difference (p < 0.01) is between the orientation of cells in the border region compared with any of the groups farther away). Quantitation was performed as described in C. Scale bars (AD), 50 μm.
Fig. 4.
Fig. 4.
Cell dispersion of reaggregates or dissociated cells placed onto the surface of E16 and E17 telencephalic explants. AC, Dispersion of reaggregates (A, E17) and dissociated cells (B, E17; C, E16) within the CVZ (the areas shown in these photomicrographs are comparable with the regions shown in Fig. 1DG).B, The pattern of cell dispersion of dissociated LGE cells placed experimentally onto the CVZ is similar to that seen in TUJ1-stained explants or focal DiI applications. C, Dissociated cells on the CVZ (red) double-labeled for TUJ1 immunoreactivity (yellow ororange) or endogenous TUJ1-positive cells (green). Note that some of the dissociated cells are TUJ1-positive (yellow arrows) and that endogenous cells (green) within the explant are intermixed with transplanted PKH-26-labeled LGE precursors.Di, PKH-26-labeled LGE cells in the region of the L–C boundary of an E16 explant. Dii shows a double exposure of Di and Diii. Diii, TUJ1-stained cells in the same field shown in Di. Note that both cells placed experimentally within the L–C boundary (Di) and endogenous cells within the explant (Diii) are oriented perpendicular to the boundary region (compare this with FH, in which the same experiment was repeated 1 d later at E17). InE, a cellular reaggregate was placed in close proximity to the L–C boundary of an E17 explant. Unlike cells in areas more distal from the boundary region (see A), cells fail to leave the reaggregate and migrate. In F, when cells were placed adjacent but not within the L–C boundary at E17, they migrate parallel to the boundary. In G and H, dissociated cells were placed experimentally within the “TUJ1-negative” L–C boundary of E17 explants. These cells extend nontapering processes, but do not migrate. H, Similar preparation to that in G, which has been stained for TUJ1. Note the double-labeled cells within the L–C boundary (yellow arrows). The presence of TUJ1 in these cells suggests that they are competent to migrate, but are inhibited from doing so by the L–C boundary. Note, however, that many of the cells shown express TUJ1 more weakly (indicated byorange rather than by yellow) than those placed in a nonboundary region. The white arrows inDG and I indicate the position of the L–C boundary. I, A freshly isolate explant stained with acridine orange to show the pattern of apoptosis. The CVZ is the darker area to the rightof the white arrows, and the LGE is thelighter area to the left. Although cells undergoing spontaneous cell death are present, they are not preferentially localized to any region of the CVZ or LGE. The areas shown in DI correspond to the area shown in Figure 2, G and H. Scale bar (AI), 50 μm.
Fig. 2.
Fig. 2.
TUJ1-positive neurons within the E17 telencephalon. A, Schematic of a coronal hemisection through the telencephalon. Letters on this schematic indicate the position and orientation of the subsequent photomicrographs (BI; in addition, Figs. 1A,B, 3AE, 4AI refer back to this diagram).B, C, TUJ1-positive neurons in a coronal section of E17 rats (white arrows indicate the division between the VZ and the SVZ). In B, a typical CVZ area ∼150 μm from the L–C boundary is shown. C, Photomicrograph of a coronal section through the L–C boundary region. Note that whereas TUJ1 cells are abundant in B, they are almost completely absent in C.DG, TUJ1-positive cells within the CVZ of flat-mounted preparations. The stippled appearance of the surface (particularly in F, which is a DIC image) is the VZ surface, which has a cobblestone contour. The arrows at the bottom of D and Gindicate the position of the L–C boundary. Note that in the boundary region, TUJ1 cells are scarce. H, High-power view of the photomicrograph shown in G. I, TUJ1 cells spanning between the LGE and MGE at E17 (the LGE and MGE are marked, and the arrowhead indicates the boundary region between these areas). Note that in this boundary region, no discontinuity in the distribution of TUJ1 cells is seen. The particulate staining in the boundary between these regions is an artifact of overstaining, not a generally observable feature of this boundary. Scale bars (AI), 50 μm. J, Number of TUJ1 cells relative to the L–C boundary within the LGE and CVZ at E17. Far fewer cells are seen in CVZ areas from 0 to 75 μm from the L–C boundary compared either with E16 (Fig.1C) or with E17 CVZ areas more distal from the boundary (i.e., >75 μm) (F(5,24) = 31.60;p < 0.001). Data were collected as indicated in Figure 1C. K, TUJ1 cells in the CVZ or the LGE are randomly oriented everywhere except in regions adjacent to the L–C boundary. Whereas cells from 0 to 75 μm from the boundary, within both the CVZ and the LGE, are preferentially oriented near 0°, cells in both telencephalic areas farther from the L–C boundary are distributed evenly at all angles between 0 and 90° (F(3,157) = 12.34; p < 0.0001 for CVZ and F(3,156) = 13.20;p < 0.0001 for LGE). Data were quantified as described in Figure 1. As in Figure 1, each point on this graph represents the orientation of a single neuron relative to the L–C boundary. L, Camera lucida drawings of representative TUJ1 cells in both the LGE and the CVZ, in regions adjacent and distant from the L–C boundary.
Fig. 3.
Fig. 3.
Focal labeling of DiI within explants of the CVZ. DiI was applied either by microinjection or by electrophoresis to the surface of E17 telencephalic explants. Explants were cultured for 12 hr and then fixed and analyzed with conventional fluorescent microscopy.AC, Cellular dispersion 12 hr after focal DiI application to the CVZ (the areas shown in these photomicrographs are comparable with the regions shown in Fig.1DG). Note that cells have dispersed considerable distances from the focally applied DiI spot and that these dispersed cells are not aligned orthogonal to the spot, indicating that they change direction as they disperse.D, E, Result of DiI application adjacent and within the L–C boundary region, respectively (the areas shown inD, E correspond to the area shown in Fig.1G,H). The blue outline in D and E represents the original extent of the DiI application. Note the diminished tangential dispersion of neurons in D compared with areas more distal from the L–C boundary (i.e.,AC). Furthermore, note that inE no cellular dispersion is observed when areas within the L–C boundary are labeled. The apparent migration of cells across the L–C boundary in E is an artifact of the labeling of axonal fascicles that run deep to the ventricular surface. Scale bars (AD), 50 μm.
Fig. 5.
Fig. 5.
The E17 L–C border restricts tangential migration through a short-range signal. A, B, The apposition of a nonboundary CVZ region (vitally labeled with PKH-26) and L–C boundary region are shown. A shows the pattern of TUJ1 staining, and B shows PKH-26 labeling. After being in culture for 12–18 hr, migration is not observed within the L–C boundary region apposed to a CVZ nonboundary region. Similarly, migration is not diminished in a CVZ nonboundary region apposed to an L–C boundary region. This is indicated both by the absence of TUJ1 cells (A) and by the PKH-26-labeled cells (B) within the L–C boundary region and the continued presence of TUJ1-positive cells within the nonboundary region (A). This result indicates that neither a long-range diffusable signal, which induces tangential migration, exists within the nonboundary region, nor does a long-range diffusable inhibitory signal exist within the nonboundary region, which prevents tangential dispersion. C, D, The control experiment in which the apposition of two nonboundary CVZ regions has been done (one of which is vitally labeled with PKH-26). In this case, TUJ1 cell staining is maintained within both nonboundary explants. In addition, some limited migration of cells has crossed between the two nonboundary explants. The limited amount likely reflects that the damaged edge of the explants artifactually inhibits tangential dispersion. E, F, PKH-26-labeled cells that were placed respectively onto nonboundary (E) and boundary (F) regions of apposed explants. G, Quantitation of the numbers of TUJ1-positive cells in explanted boundary and nonboundary regions after being apposed experimentally. This result supports the notion that the mechanism restricting tangential migration within the L–C boundary acts over very restricted distances. When the number of TUJ1 cells in the boundary region from tissue fixed immediately after isolation is compared with that seen in CVZ boundary regions that were apposed to nonboundary regions, no significant difference is observed. Similarly, nonboundary tissue fixed immediately after isolation does not have significantly different numbers of TUJ1 cells compared with nonboundary explants apposed to either boundary or nonboundary explants. Quantitative analysis entailed examination of TUJ1 cells in five different experimental preparations in each test category. Scale bars (AF), 50 μm.
Fig. 6.
Fig. 6.
Radial glial cells coalesce in the vicinity of the L–C boundary near the time tangential dispersion is initiated.A, Coronal hemisection of the forebrain (compare with Fig. 7, schematic). The stippled boxed area indicates the region shown in B and C.B, Distribution of RC2-positive cells (a radial glial marker) in the region of the L–C boundary before the initiation of tangential dispersion, at E15. C, Distribution of radial glia 2 d later in development (also visualized by RC2 staining). Note that although dense radial glia are present throughout the CVZ and LGE, in the boundary region, these radial glia form a palisade as they extend away from the VZ regions. Although we have no evidence that the radial glia in the boundary region are biochemically distinct from those in adjacent regions of VZ, their position and development correlate exactly with the region of the L–C boundary where tangential dispersion is inhibited. Arrows indicate the position of the radial glial palisade as it extends into the intermediate zone. Scale bars, 100 μm.
Fig. 7.
Fig. 7.
Schematic of cell dispersion within the telencephalon. The area demarcated by the dashed linesin the coronal section through telencephalon in the top left of this diagram indicates the region shown in the three-dimensional cut-away drawing. The LGE is indicated inlight yellow in both drawings. The CVZ is indicated ingreen, and the decreased gradient in coloring corresponds with the area within which tangential dispersion within the CVZ is inhibited at E17 (i.e., dark green, total inhibition; lighter green, reduced inhibition). Thedark green area corresponds with the zone of the L–C boundary where TUJ1-stained cells are excluded. The pattern of migration of neural cells within the VZ and through the postmitotic areas of the telencephalon is shown. Arrows within the LGE and CVZ indicate that throughout most of the telencephalon cell, dispersion appears to be unrestricted. The red trailfollowing some of the dispersing cells represents our notion of the typical migratory pattern of dispersing VZ cells. Note that near the L–C boundary, migration of dispersing cells tends to align along the boundary region and that decreased numbers of dispersing cells are seen in this region on the CVZ side of the boundary. Cells that were placed in the region of the L–C boundary of explants (dark green area) remain rounded and are able to extend only short process (see Fig. 4G,H). Cell dispersion occurs at all stages of their migration (O’Rourke et al., 1992). Beginning with tangential dispersion, we suggest that differentiating cells alternate between migration along radial glia and tangential dispersion. Note that a number of lines of recent evidence support the idea that specific populations of striatal cells may migrate to through the intermediate zone to the cerebral cortex. This is indicated by the three circled migrating striatal neurons (green) shown transiting dorsally as indicated. The large red arrows indicate the general pattern of cell migration in various regions of the telencephalon, whereassmaller red lines indicate the trajectory of individual cells. C, Cortex; CP, cortical plate;CVZ, cortical ventricular zone; IZ, intermediate zone; LCS, lateral cortical stream;LGE, lateral ganglionic eminence; MGE, medial ganglionic eminence; SVZ, subventricular zone.

References

    1. Alvarez-Buylla A, Theelen M, Nottebohm F. Mapping of radial glia and of a new cell type in adult canary brain. J Neurosci. 1988;8:2702–2712. - PMC - PubMed
    1. Anderson SA, Eisenstat DD, Shi L, Rubenstein JLR. Interneuron migration from basal forebrain to neocortex: dependence on Dlx genes. Science. 1997;278:474–476. - PubMed
    1. Angevine JB, Sidman RL. Autoradiographic study of cell migration during histogenesis of cerebral cortex in the mouse. Nature. 1961;192:766–768. - PubMed
    1. Austin CP, Cepko CL. Cellular migration patterns in the developing mouse cerebral cortex. Development. 1990;110:713–732. - PubMed
    1. Bally-Cuif L, Alvarado-Mallart RM, Darnell DK, Wassef M. Relationship between Wnt-1 and En-2 expression domains during early development of normal and ectopic met-mesencephalon. Development. 1992;115:999–1009. - PubMed

Publication types

LinkOut - more resources