

Detectability index measures of binaural masking level difference across populations of inferior colliculus neurons
- PMID: 9364078
- PMCID: PMC6573599
- DOI: 10.1523/JNEUROSCI.17-23-09331.1997
Detectability index measures of binaural masking level difference across populations of inferior colliculus neurons
Abstract
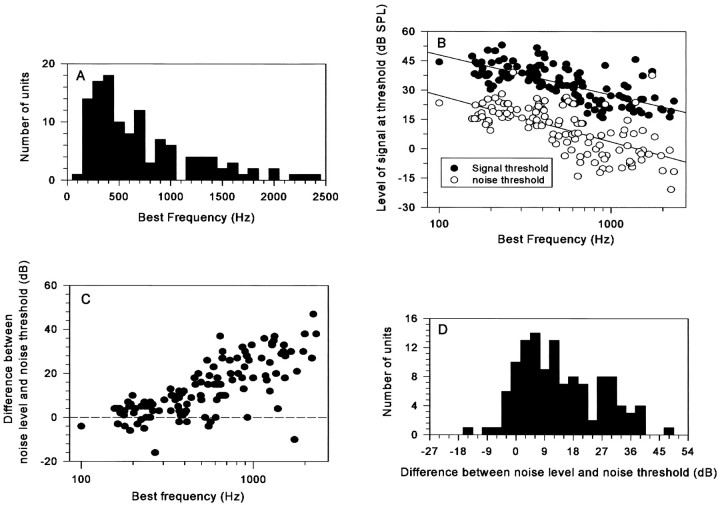
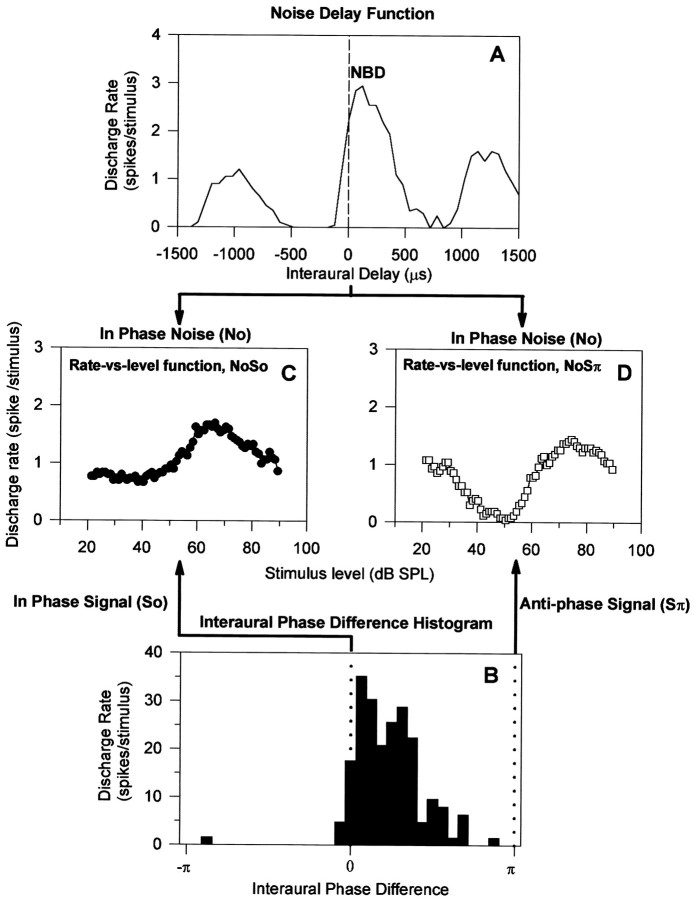
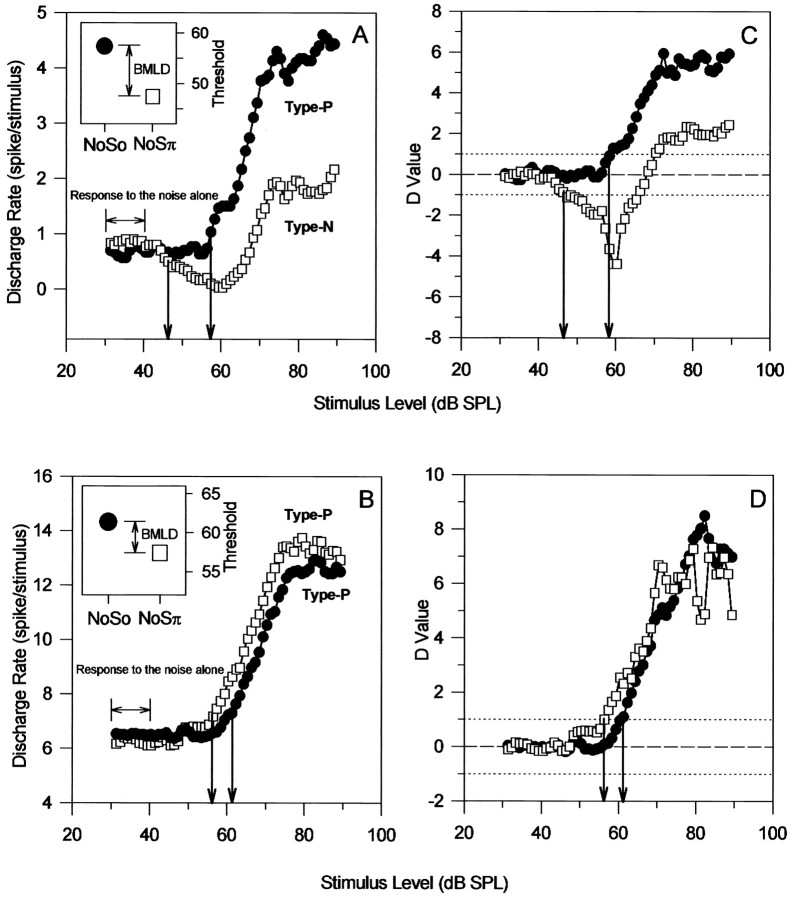
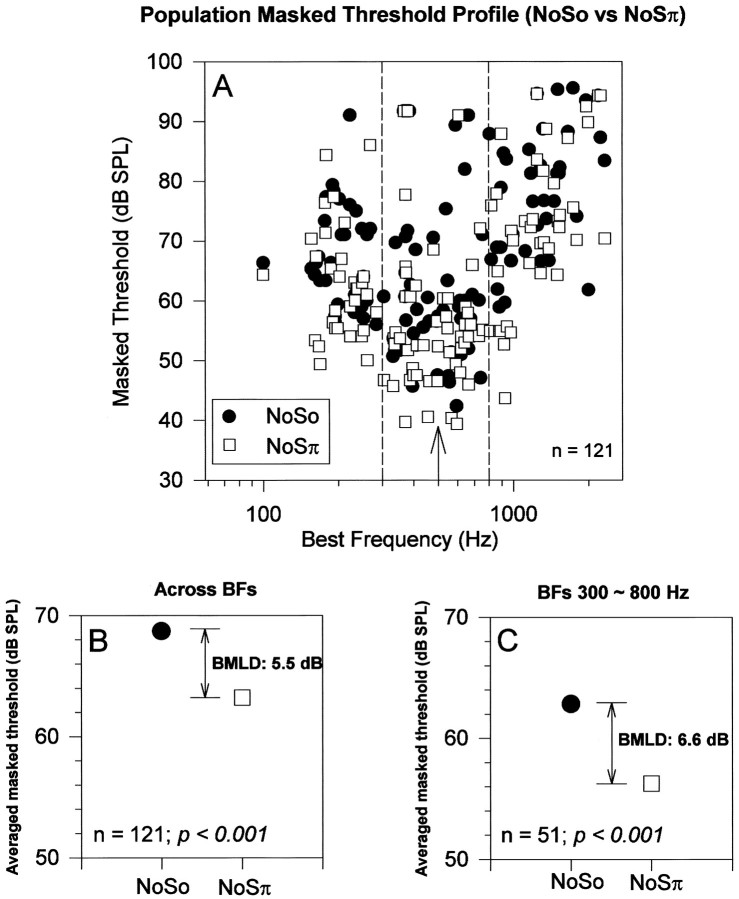
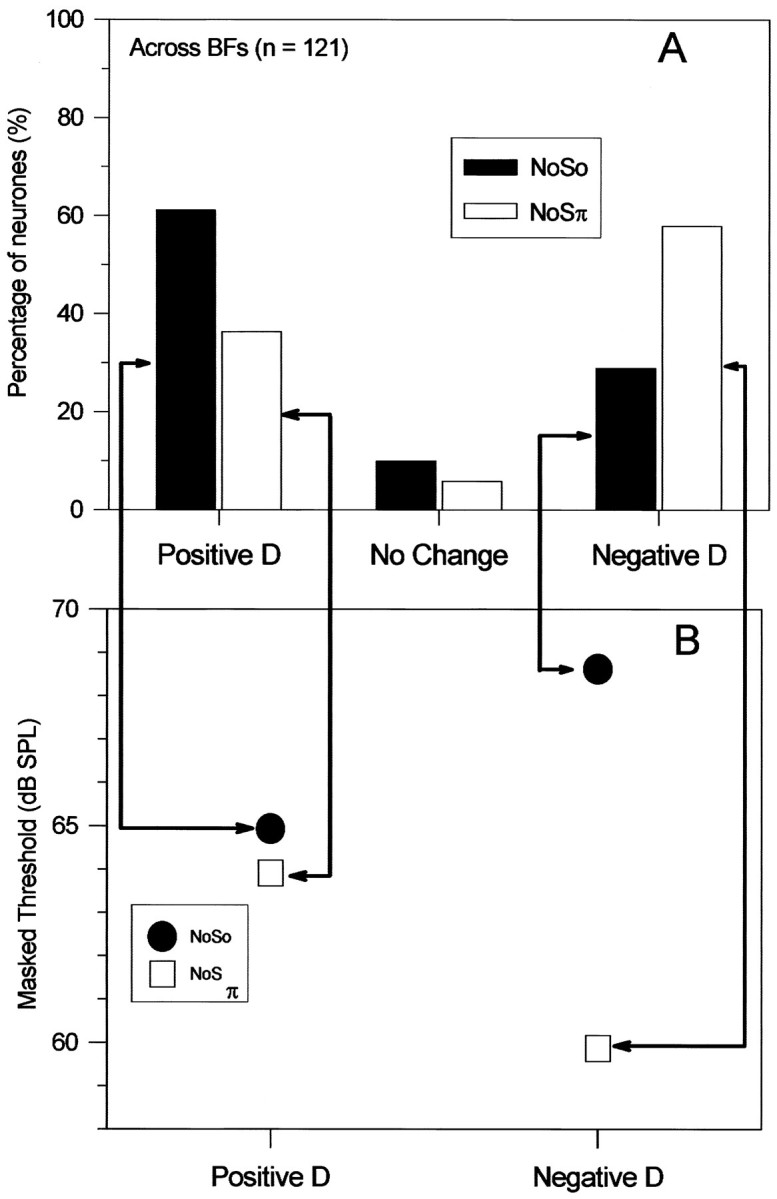
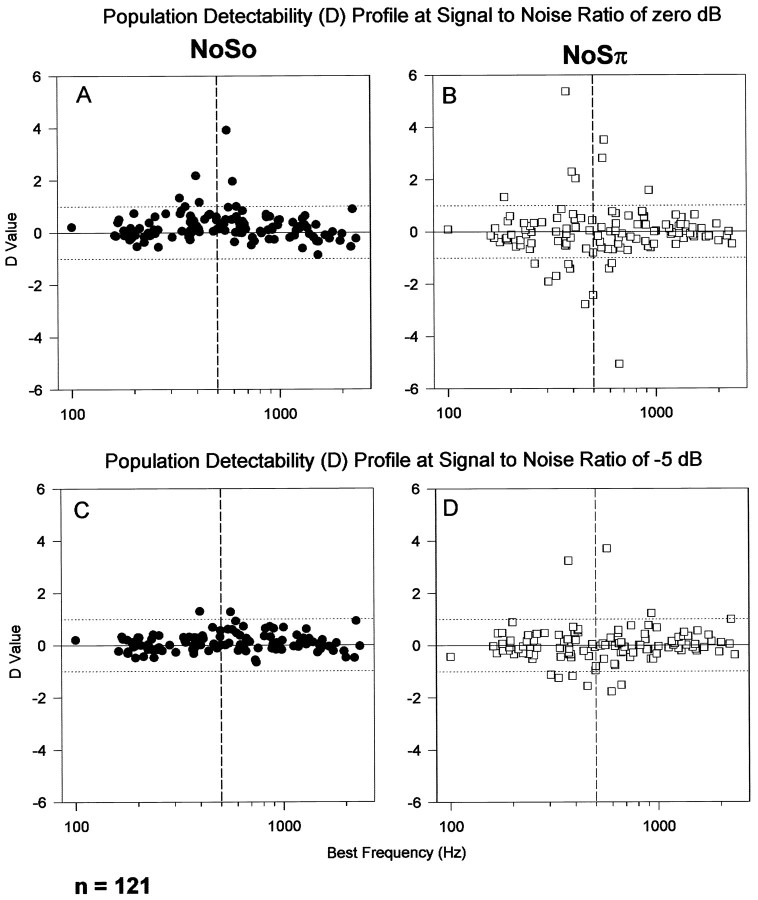
In everyday life we continually need to detect signals against a background of interfering noise (the "cocktail party effect"): a task that is much easier to accomplish using two ears. The binaural masking level difference (BMLD) measures the ability of listeners to use a difference in binaural attributes to segregate sound sources and thus improve their discriminability against interfering noises. By computing the detectability of tones from rate-versus-level functions in the presence of a suprathreshold noise, we previously demonstrated that individual low-frequency delay-sensitive neurons in the inferior colliculus are able to show BMLDs. Here we consider the responses of a population of such neurons when the noise level is held constant (as conventionally in psychophysical paradigms). We have sampled the responses of 121 units in the inferior colliculi of five guinea pigs to identical noise and 500 Hz tones at both ears (NoSo) and to identical noise but with the 500 Hz tone at one ear inverted (NoSpi). The result suggests that the neurons subserving detection of So tones in No (identical noise at the two ears) noise are those neurons with best frequencies (BFs) close to 500 Hz that respond to So tones with an increase in their discharge rate from that attributable to the noise. The detection of the inverted (Spi) signal is also attributable to neurons with BFs close to 500 Hz. However, among these neurons, the presence of the Spi tone was indicated by an increased discharge rate in some neurons and by a decreased discharge rate in others.
Figures
Similar articles
-
Responses of neurons in the inferior colliculus to binaural masking level difference stimuli measured by rate-versus-level functions.J Neurophysiol. 1997 Jun;77(6):3085-106. doi: 10.1152/jn.1997.77.6.3085. J Neurophysiol. 1997. PMID: 9212259
-
Neural responses in the inferior colliculus to binaural masking level differences created by inverting the noise in one ear.J Neurophysiol. 2000 Aug;84(2):844-52. doi: 10.1152/jn.2000.84.2.844. J Neurophysiol. 2000. PMID: 10938311
-
Desynchronizing responses to correlated noise: A mechanism for binaural masking level differences at the inferior colliculus.J Neurophysiol. 1999 Feb;81(2):722-34. doi: 10.1152/jn.1999.81.2.722. J Neurophysiol. 1999. PMID: 10036273
-
Binaural masking level differences in the inferior colliculus of the guinea pig.J Acoust Soc Am. 1996 Jul;100(1):490-503. doi: 10.1121/1.415862. J Acoust Soc Am. 1996. PMID: 8675842
-
Binaural masking and sensitivity to interaural delay in the inferior colliculus.Philos Trans R Soc Lond B Biol Sci. 1992 Jun 29;336(1278):415-22. doi: 10.1098/rstb.1992.0077. Philos Trans R Soc Lond B Biol Sci. 1992. PMID: 1354383
Cited by
-
Responses to diotic tone-in-noise stimuli in the inferior colliculus: stimulus envelope and neural fluctuation cues.Hear Res. 2021 Sep 15;409:108328. doi: 10.1016/j.heares.2021.108328. Epub 2021 Aug 2. Hear Res. 2021. PMID: 34391193 Free PMC article.
-
Neural correlates and mechanisms of spatial release from masking: single-unit and population responses in the inferior colliculus.J Neurophysiol. 2005 Aug;94(2):1180-98. doi: 10.1152/jn.01112.2004. Epub 2005 Apr 27. J Neurophysiol. 2005. PMID: 15857966 Free PMC article.
-
Responses to dichotic tone-in-noise stimuli in the inferior colliculus.Front Neurosci. 2022 Dec 1;16:997656. doi: 10.3389/fnins.2022.997656. eCollection 2022. Front Neurosci. 2022. PMID: 36532285 Free PMC article.
-
Neural Correlates of the Binaural Masking Level Difference in Human Frequency-Following Responses.J Assoc Res Otolaryngol. 2017 Apr;18(2):355-369. doi: 10.1007/s10162-016-0603-7. Epub 2016 Nov 28. J Assoc Res Otolaryngol. 2017. PMID: 27896486 Free PMC article.
-
Interaural level difference discrimination thresholds for single neurons in the lateral superior olive.J Neurosci. 2008 May 7;28(19):4848-60. doi: 10.1523/JNEUROSCI.5421-07.2008. J Neurosci. 2008. PMID: 18463238 Free PMC article.
References
-
- Bullock D, Palmer AR, Rees A. A compact and easy to use tungsten-in-glass microelectrode manufacturing workstation. Med Biol Eng Comput. 1988;26:669–672. - PubMed
-
- Caird D, Pillman F, Klinke R. Responses of single cells in the cat inferior colliculus to binaural difference signals. Hear Res. 1989;43:1–24. - PubMed
-
- Caird DM, Palmer AR, Rees A. Binaural masking level difference effects in single units of the guinea pig inferior colliculus. Hear Res. 1991;57:91–106. - PubMed
-
- Delgutte B. Peripheral processing of speech information: implication from a physiological study of intensity discrimination. In: Schouten MEH, editor. The psychophysics of speech perception. Nijhoff; Dordrecht: 1987. pp. 333–353.
-
- Durlach NI. Equalization and cancellation theory of binaural masking-level differences. J Acoust Soc Am. 1963;35:1206–1218.
MeSH terms
LinkOut - more resources
Full Text Sources