. 1997 Nov 25;94(24):12969-74.
doi: 10.1073/pnas.94.24.12969.

Erythrocyte membrane vesiculation: model for the molecular mechanism of protein sorting

Affiliations

Erythrocyte membrane vesiculation: model for the molecular mechanism of protein sorting

D W Knowles et al. Proc Natl Acad Sci U S A. .

Abstract

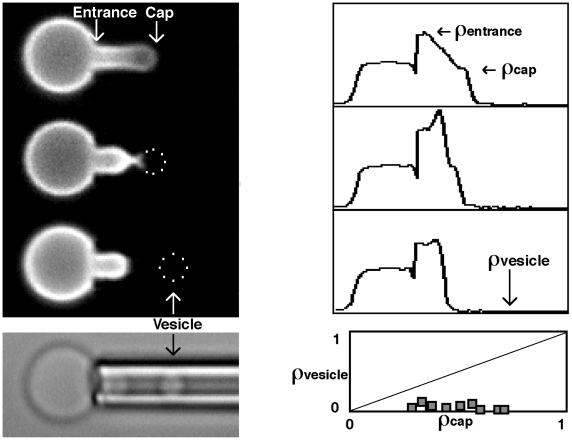
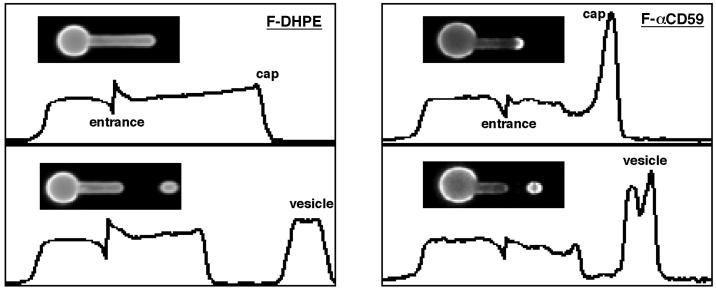
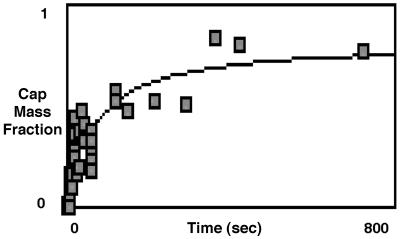
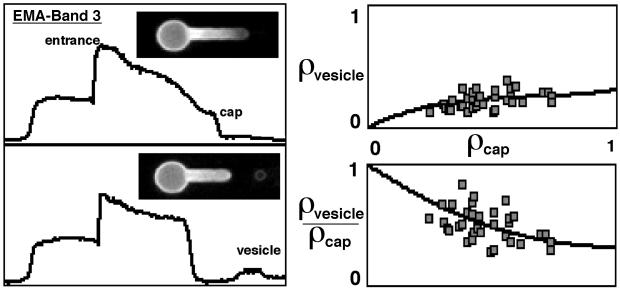
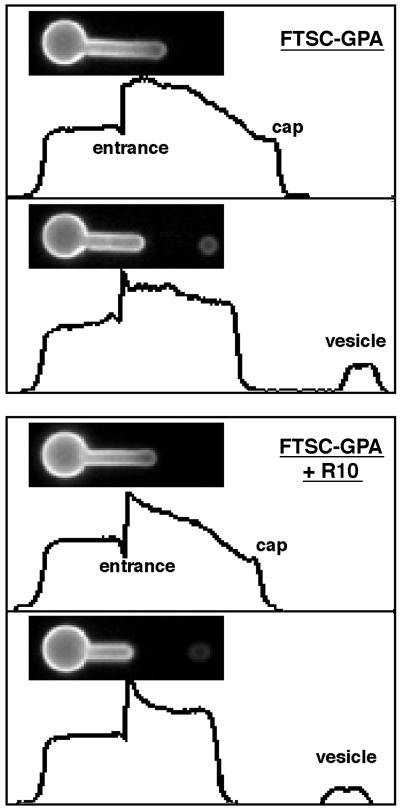
Budding and vesiculation of erythrocyte membranes occurs by a process involving an uncoupling of the membrane skeleton from the lipid bilayer. Vesicle formation provides an important means whereby protein sorting and trafficking can occur. To understand the mechanism of sorting at the molecular level, we have developed a micropipette technique to quantify the redistribution of fluorescently labeled erythrocyte membrane components during mechanically induced membrane deformation and vesiculation. Our previous studies indicated that the spectrin-based membrane skeleton deforms elastically, producing a constant density gradient during deformation. Our current studies showed that during vesiculation the skeleton did not fragment but rather retracted to the cell body, resulting in a vesicle completely depleted of skeleton. These local changes in skeletal density regulated the sorting of nonskeletal membrane components. Highly mobile membrane components, phosphatidylethanolamine- and glycosylphosphatidylinositol-linked CD59 with no specific skeletal association were enriched in the vesicle. In contrast, two components with known specific skeletal association, band 3 and glycophorin A, were differentially depleted in vesicles. Increasing the skeletal association of glycophorin A by liganding its extrafacial domain reduced the fraction partitioning to the vesicle. We conclude that this technique of bilayer/skeleton uncoupling provides a means with which to study protein sorting driven by changes in local skeletal density. Moreover, it is the interaction of particular membrane components with the spectrin-based skeleton that determines molecular partitioning during protein sorting.


Figures

Figure 1
Figure 1
Fluorescence micrographs and corresponding intensity profiles of rhodamine phalloidin-labeled actin in erythrocytes. Intensity profiles were plotted as relative fluorescence intensity (ordinate) vs. distance along the deformation axis (abscissa). Microaspiration deformed the skeleton resulting in an actin density that was highest at the pipette entrance (ρentrance) and decreased toward the cap (ρcap) (top fluorescence image). During vesiculation the skeleton retracted to the cell body leaving the vesicle (dotted outline) depleted of actin (two middle fluorescence images and bottom bright-field image). The bottom right plot shows that the relative density of rhodamine phalloidin-labeled actin in the vesicle was independent of the normalized density of the prevesiculation cap (0.07 ± 0.03). Each data point (squares) represents a single vesiculation event. This is clearly different from a membrane fragmentation process in which ρvesicle would equal ρcap (dashed line). Fluorescence intensity of an image varies because of (i) spatial distribution of labeled molecules and (ii) object geometry. In the intensity profiles, variations because of geometry have been removed with appropriate integration and intensities were normalized with the mean intensity of the spherical portion of the cell.
Figure 2
Figure 2
Fluorescence micrographs and corresponding intensity profiles of fluorescein-DHPE and fluorescein-anti-CD59. Intensity profiles were plotted as relative fluorescence intensity (ordinate) vs. distance along the deformation axis (abscissa). Fluorescein-DHPE sorting resulted in a small density gradient along the aspirated membrane portion, during microdeformation (Upper Left) and a slight increase in the vesicle density after vesiculation (Lower Left). In contrast, sorting of fluorescein-anti-GPI-linked CD59 resulted in an accumulation at the cap (Upper Right) and an enriched vesicle density after vesiculation (Lower Right).
Figure 3
Figure 3
Temporal behavior of fluorescein-anti-CD59 after microdeformation. The amount of labeled CD59 that migrated toward the cap as a fraction of the total amount in the aspirated membrane projection (cap mass fraction) is plotted as a function of time. The cap mass fraction was calculated from integrals of the density profiles for the migratory portion and total amount of aspirated labeled CD59. Note that in short times (∼1 sec after deformation), there was no collection of CD59 at the cap. At longer times (>400 sec) almost 100% of the aspirated labeled CD59 migrated toward the cap.
Figure 4
Figure 4
Fluorescence micrographs and corresponding intensity profiles of EMA-labeled band 3. Intensity profiles were plotted as relative fluorescence intensity (ordinate) vs. distance along the deformation axis (abscissa). After microdeformation labeled band 3 exhibited a density gradient similar but less steep than that of labeled actin (Upper Left). After vesiculation, and in contrast to actin, the resulting vesicle clearly showed membrane-associated labeled band 3 (Lower Left). The band 3 vesicle density (ρvesicle) showed a nonlinear dependence on the cap density prior to vesiculation (ρcap) (Upper Right). This dependence suggested that as ρcap decreased, a greater fraction of band 3 in the prevesiculated cap was partitioning into the vesicle (enrichment) (Lower Right).
Figure 5
Figure 5
Fluorescence micrographs and corresponding intensity profiles of FTSC-labeled glycophorin A in the absence and presence of mAb R10. Intensity profiles were plotted as relative fluorescence intensity (ordinate) vs. distance along the deformation axis (abscissa). The two upper images show vesiculation of glycophorin A in the absence of R10 binding. After microdeformation, labeled glycophorin A exhibited a density gradient that was less steep than that of either labeled actin or band 3. Vesicles clearly showed membrane associated labeled glycophorin A, which was at a higher density than band 3. The two lower images show vesiculation of glycophorin A in the presence of R10 binding. R10 binding decreased the partitioning of FTSC-labeled glycophorin A into the vesicle.

References

    1. Ciechanover A, Schwartz A L, Dautry-Varsat A, Lodish H F. J Biol Chem. 1983;258:9681–9689. - PubMed
    1. Horton M A. Exp Cell Res. 1983;144:361–366. - PubMed
    1. Okumura N, Tsuji K, Nakahata T. Blood. 1992;80:642–650. - PubMed
    1. Vuillett-Gaugler M, Breton-Gorius J, Vainchenker W, Guichard J, Leroy C, Tchernia G, Coulombel L. Blood. 1990;75:865–873. - PubMed
    1. Frazier J L, Caskey H J, Yoffe M, Seligman P A. J Clin Invest. 1982;69:853–865. - PMC - PubMed

Publication types

MeSH terms

Substances

LinkOut - more resources