

The R1 component of mammalian ribonucleotide reductase has malignancy-suppressing activity as demonstrated by gene transfer experiments
- PMID: 9371820
- PMCID: PMC24283
- DOI: 10.1073/pnas.94.24.13181
The R1 component of mammalian ribonucleotide reductase has malignancy-suppressing activity as demonstrated by gene transfer experiments
Abstract
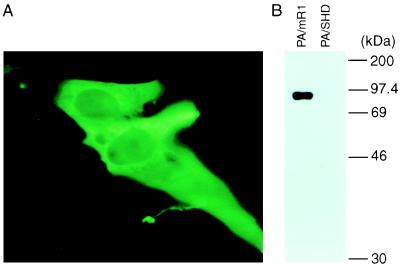
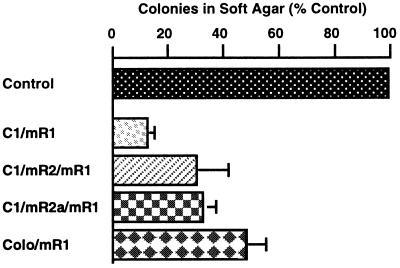
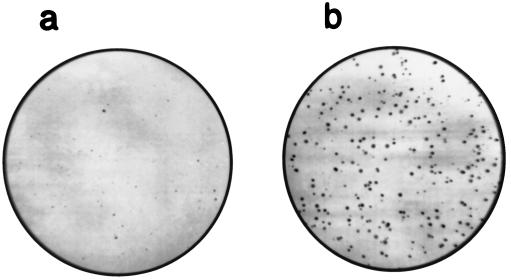
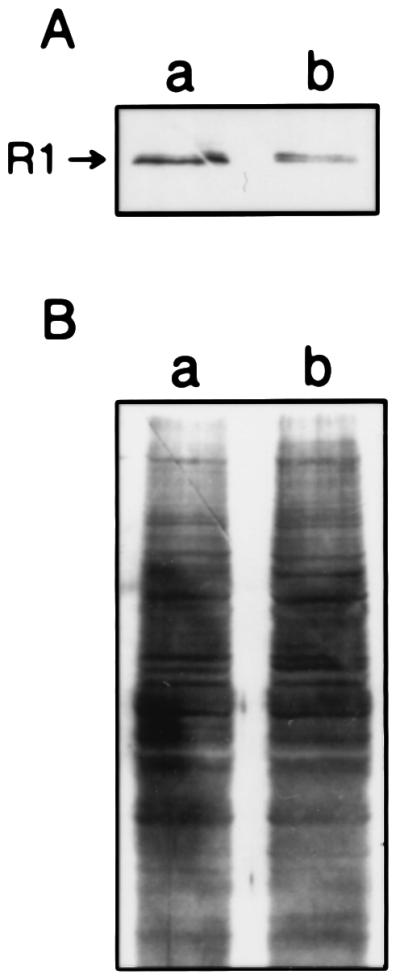
Our recent studies have shown that deregulated expression of R2, the rate-limiting component of ribonucleotide reductase, enhances transformation and malignant potential by cooperating with activated oncogenes. We now demonstrate that the R1 component of ribonucleotide reductase has tumor-suppressing activity. Stable expression of a biologically active ectopic R1 in ras-transformed mouse fibroblast 10T(1/2) cell lines, with or without R2 overexpression, led to significantly reduced colony-forming efficiency in soft agar. The decreased anchorage independence was accompanied by markedly suppressed malignant potential in vivo. In three ras-transformed cell lines, R1 overexpression resulted in abrogation or marked suppression of tumorigenicity. In addition, the ability to form lung metastases by cells overexpressing R1 was reduced by >85%. Metastasis suppressing activity also was observed in the highly malignant mouse 10T(1/2) derived RMP-6 cell line, which was transformed by a combination of oncogenic ras, myc, and mutant p53. Furthermore, in support of the above observations with the R1 overexpressing cells, NIH 3T3 cells cotransfected with an R1 antisense sequence and oncogenic ras showed significantly increased anchorage independence as compared with control ras-transfected cells. Finally, characteristics of reduced malignant potential also were demonstrated with R1 overexpressing human colon carcinoma cells. Taken together, these results indicate that the two components of ribonucleotide reductase both are unique malignancy determinants playing opposing roles in its regulation, that there is a novel control point important in mechanisms of malignancy, which involves a balance in the levels of R1 and R2 expression, and that alterations in this balance can significantly modify transformation, tumorigenicity, and metastatic potential.
Figures
References
-
- Lewis W H, Kuzik B A, Wright J A. J Cell Physiol. 1978;94:287–298. - PubMed
-
- Reichard P. Science. 1993;260:1773–1777. - PubMed
-
- Wright J A. Int Encyclop Pharmacol Therapeut. 1989;128:89–111.
-
- Tonin P N, Stallings R L, Carman M D, Bertino J R, Wright J A, Srinivasan P R, Lewis W H. Cytogenet Cell Genet. 1987;45:102–108. - PubMed
-
- Wright J A, Chan A K, Choy B K, Hurta R A R, McClarty G A, Tagger A Y. Biochem Cell Biol. 1990;68:1364–1371. - PubMed
Publication types
MeSH terms
Substances
LinkOut - more resources
Full Text Sources
Other Literature Sources
Research Materials
Miscellaneous
