

Ultrasonographic study of ductus venosus in healthy neonates
- PMID: 9377136
- PMCID: PMC1720700
- DOI: 10.1136/fn.77.2.f131
Ultrasonographic study of ductus venosus in healthy neonates
Abstract
Aim: To assess ultrasonographically the flow pattern and the time of postnatal closure of ductus venosus related to the other fetal shunts.
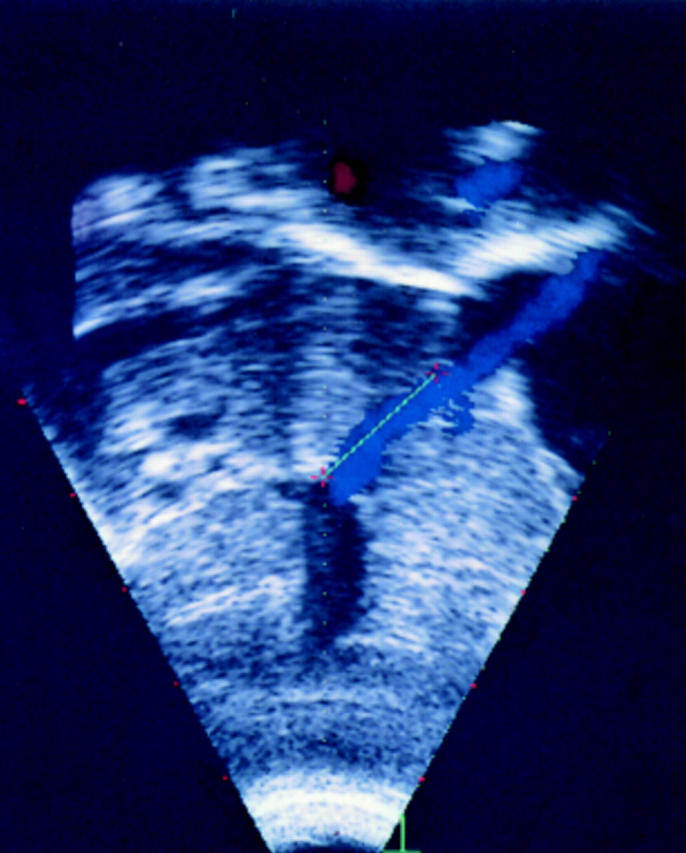
Methods: Fifty healthy, term neonates were studied from day 1 up to day 18 using a VingMed CFM 800A ultrasound scanner.
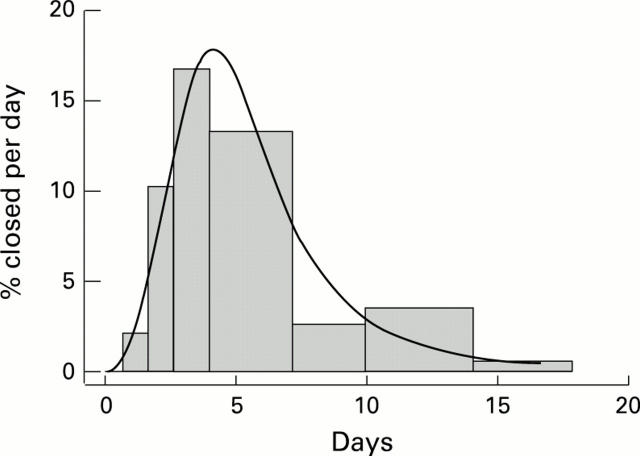
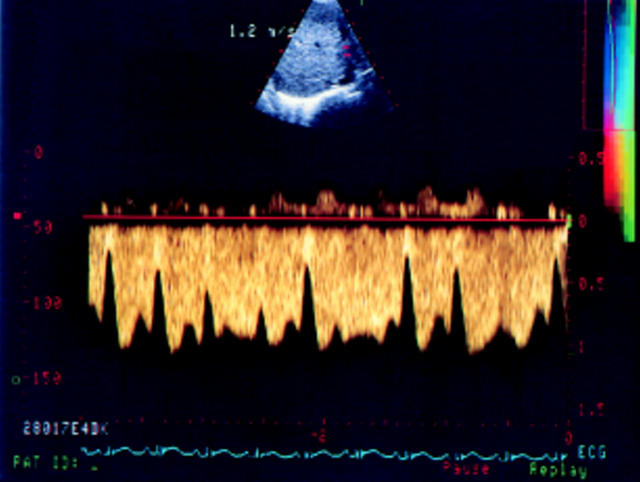
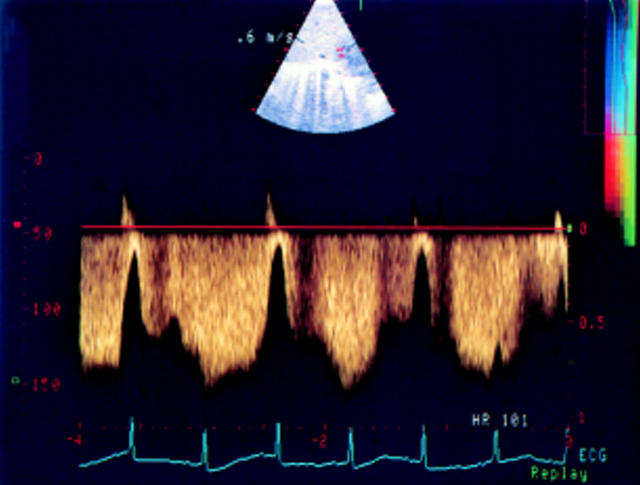
Results: Ductus arteriosus was closed in 94% of the infants before day 3. Ductus venosus, however, was closed in only 12% at the same time, in 76% before day 7, and in all infants before day 18. A closed ductus venosus or ductus arteriosus did not show signs of reopening. Pulsed and colour Doppler flow could be detected across the foramen ovale in all infants during the sequential investigation. At day 1, when the pulmonary vascular resistance was still high, a reversed Doppler flow velocity signal was seen in ductus venosus in 10 infants (20%) and a bidirectional flow in ductus arteriosus in 26 (52%). Closure of the ductus venosus was not significantly correlated with closure of the ductus arteriosus nor related to sex nor weight loss.
Conclusions: The time of closure of the ductus venosus evaluated by ultrasonography is much later than that of the ductus arteriosus. The flow pattern in ductus venosus reflects the portocaval pressure gradient and the pressure on the right side of the heart and in the pulmonary arteries. Both the flow pattern in the ductus venosus as well as that in the ductus arteriosus may be an indication of compromised neonatal haemodynamics.
Figures
References
MeSH terms
LinkOut - more resources
Full Text Sources