. 1997 Sep 30;94(20):11079-84.
doi: 10.1073/pnas.94.20.11079.

Molecular and functional characterization of a novel low-affinity cation transporter (LCT1) in higher plants

Affiliations

Molecular and functional characterization of a novel low-affinity cation transporter (LCT1) in higher plants

D P Schachtman et al. Proc Natl Acad Sci U S A. .

Abstract

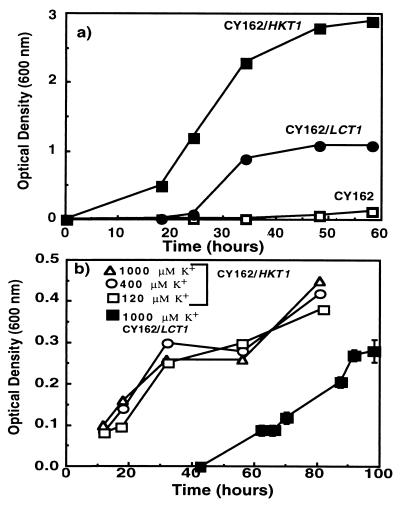
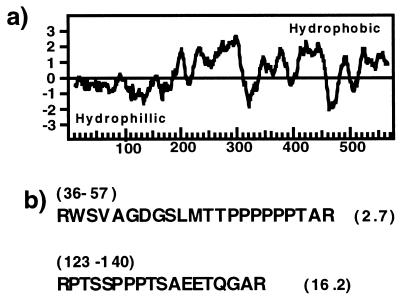
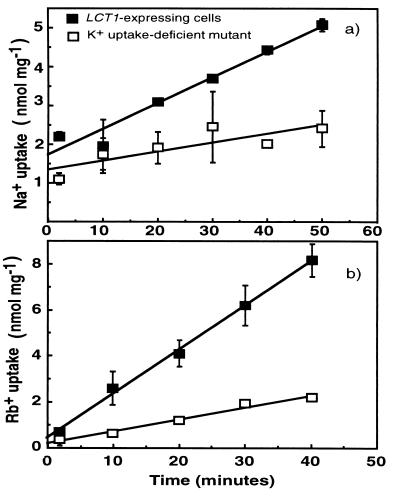
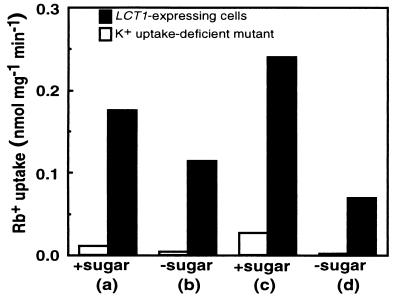
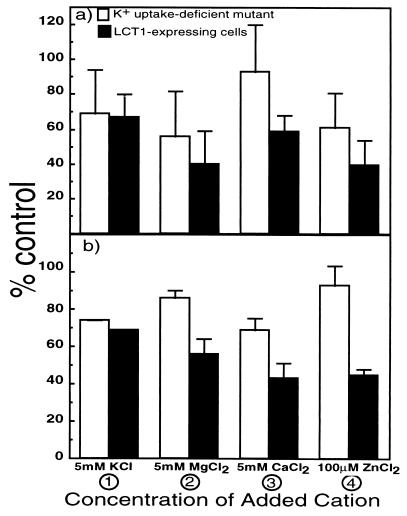
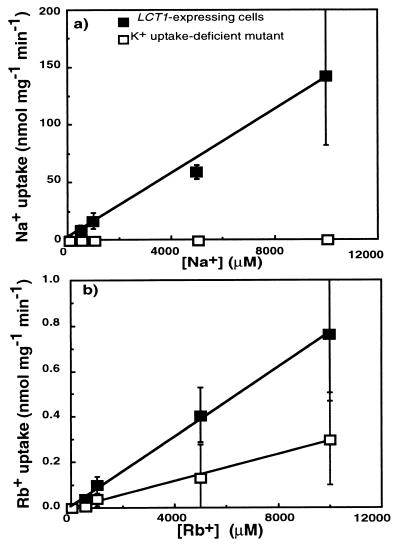
The transport of cations across membranes in higher plants plays an essential role in many physiological processes including mineral nutrition, cell expansion, and the transduction of environmental signals. In higher plants the coordinated expression of transport mechanisms is essential for specialized cellular processes and for adaptation to variable environmental conditions. To understand the molecular basis of cation transport in plant roots, a Triticum aestivum cDNA library was used to complement a yeast mutant deficient in potassium (K+) uptake. Two genes were cloned that complemented the mutant: HKT1 and a novel cDNA described in this report encoding a cation transporter, LCT1 (low-affinity cation transporter). Analysis of the secondary structure of LCT1 suggests that the protein contains 8-10 transmembrane helices and a hydrophilic amino terminus containing sequences enriched in Pro, Ser, Thr, and Glu (PEST). The transporter activity was assayed using radioactive isotopes in yeast cells expressing the cDNA. LCT1 mediated low-affinity uptake of the cations Rb+ and Na+, and possibly allowed Ca2+ but not Zn2+ uptake. LCT1 is expressed in low abundance in wheat roots and leaves. The precise functional role of this cation transporter is not known, although the competitive inhibition of cation uptake by Ca2+ has parallels to whole plant and molecular studies that have shown the important role of Ca2+ in reducing Na+ uptake and ameliorating Na+ toxicity. The structure of this higher plant ion transport protein is unique and contains PEST sequences.


Figures

Figure 1
Figure 1
Growth of S. cerevisiae strains over time (a) in yeast nitrogen base medium supplemented with sucrose and galactose (7 mM K+) and (b) in arginine-phosphate medium with concentrations of 120–1,000 μM K+ supplemented with sucrose and galactose (means ± SD). All strains were derived by transformation of the CY162 cells and contain the plasmid pYES2. CY162 contains the empty pYES2 plasmid, CY162/HKT1 has the pYES2 plasmid containing HKT1, and CY162/LCT1 has the pYES2 plasmid containing LCT1.
Figure 2
Figure 2
Analysis of the nucleotide sequence of LCT1. (a) Hydropathy plot according to Kyte–Doolittle algorithim (42) and window size 19. (b) Deduced amino acid sequence of putative PEST sequences with PEST scores shown at right.
Figure 3
Figure 3
The uptake of Na+ and Rb+ over time in LCT1-expressing cells and the K+ uptake-deficient cells. The mean uptake rates in 1 mM Na+ (a) and 1 mM Rb+ (b) over time in the K+ uptake-deficient cells (□) and in LCT1-expressing cells (▪) (n = 2 for Na+ and n = 4 experiments for Rb+ ± SD). Lines were fitted by linear regression.
Figure 4
Figure 4
Short-term (6 min) uptake of Rb+ by K+ uptake-deficient cells (open bars) and in LCT1-expressing cells (filled bars) depends on the phase of growth and on the presence of carbon (sucrose/galactose) in the flux buffer. Cells in stationary phase are shown in columns a and b, and cells in the logarithmic phase of growth are shown in columns c and d. Presence of carbon source is denoted by +sugar and absence by −sugar. The rate of uptake was measured in 1 mM Rb+ for LCT1-expressing cells and K+ uptake-deficient cells. Log phase for LCT1-expressing cells was between 0.2 and 0.6 OD600 and for CY162 cells grown in 100 mM KCl was 0.8–1.7.
Figure 5
Figure 5
Rubidium uptake measured at 1 mM, as a function of different added ions in LCT1-expressing cells (filled bars) and K+ uptake-deficient cells (open bars) ± SD (n = 3 separate experiments). Uptake of Rb+ was measured over (a) the short term (6 min) and (b) the long term (40 min).
Figure 6
Figure 6
Short-term (6 min) uptake rates at different concentrations of Na+ and Rb+ by LCT1-expressing cells (▪) and by K+ uptake-deficient cells (□). Means ± SD (n = 3–4 separate experiments) of (a) Na+ uptake and (b) Rb+ uptake. Lines were fitted by linear regression.
Figure 7
Figure 7
RT-PCR of total T. aestivum cv. Atlas 66 RNA with LCT1-specific primers. Lanes: 1, 1-kb marker (GIBCO/BRL); 2 and 3, PCRs performed on total T. aestivum root and leaf cDNA, respectively; 4 and 5, PCRs performed on total T. aestivum root and leaf RNA reactions without reverse transcriptase to check for any DNA contamination in RNA.

References

    1. Epstein E. BioScience. 1977;27:783–787.
    1. Marschner H. Mineral Nutrition of Higher Plants. San Diego: Academic; 1995.
    1. Schachtman D P, Schroeder J I. Nature (London) 1994;370:655–658. - PubMed
    1. Sentenac H, Bonneaud N, Minet M, Lacroute F, Salmon J, Gaymard F, Grignon C. Science. 1992;256:663–665. - PubMed
    1. Schroeder J I, Ward J M, Gassmann W. Annu Rev Biophys Biomol Struct. 1994;23:441–471. - PubMed

Publication types

LinkOut - more resources