. 1997 Dec 1;139(5):1137-55.
doi: 10.1083/jcb.139.5.1137.

Golgi tubule traffic and the effects of brefeldin A visualized in living cells

Affiliations

Golgi tubule traffic and the effects of brefeldin A visualized in living cells

N Sciaky et al. J Cell Biol. .

Abstract

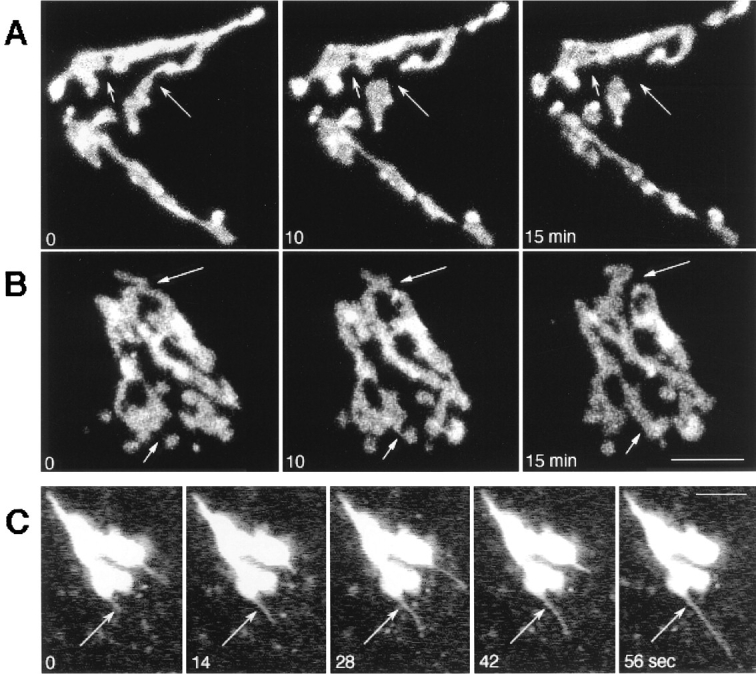
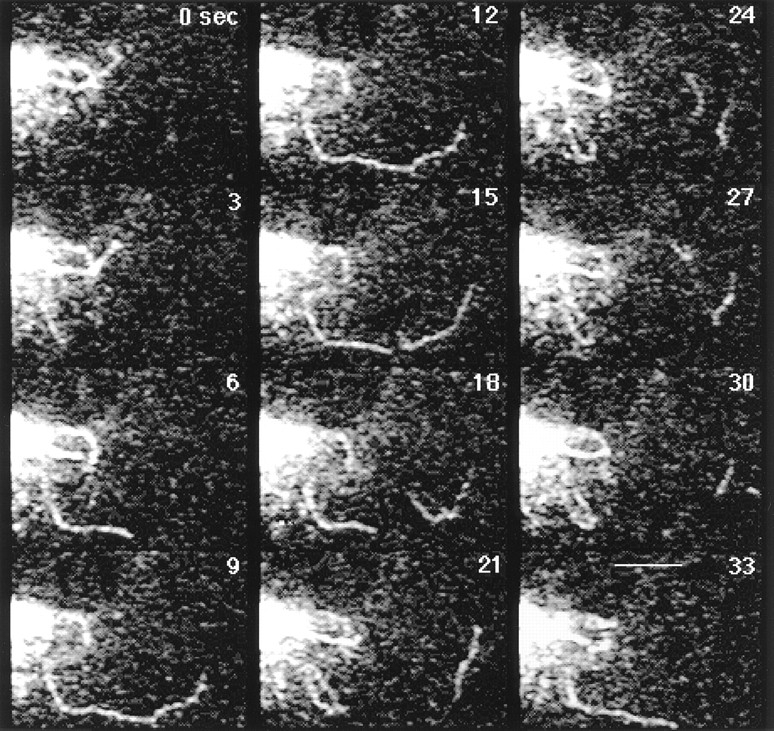
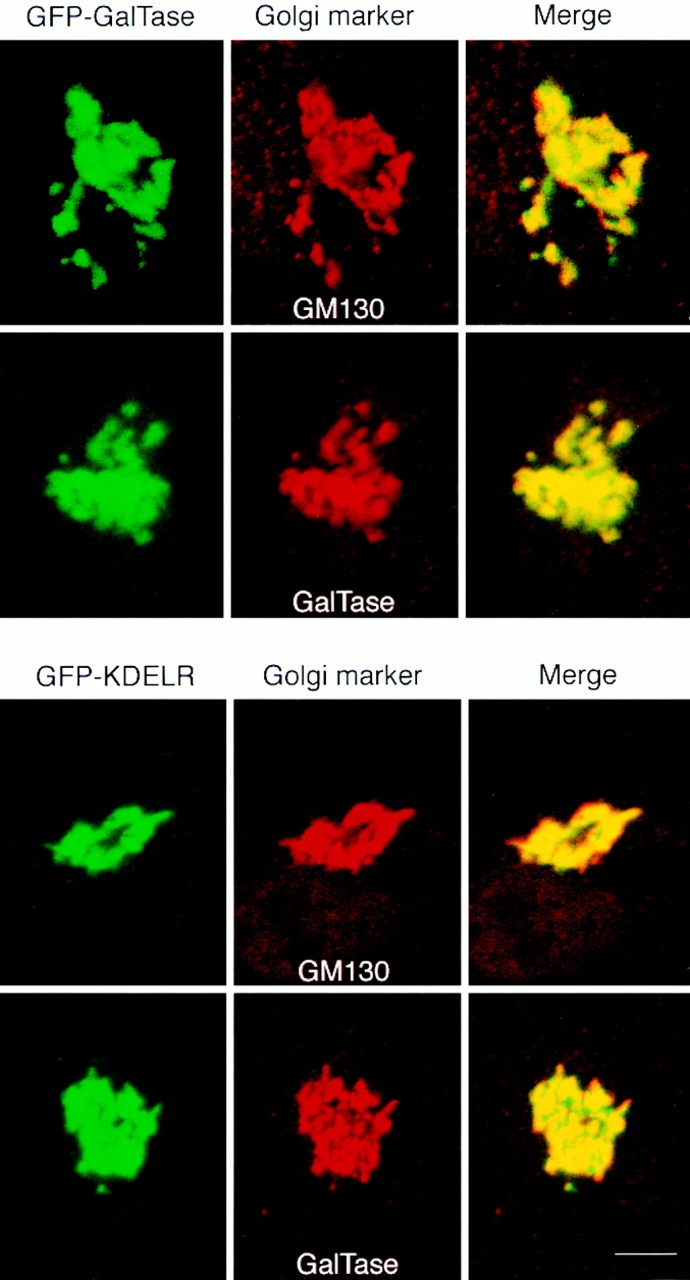
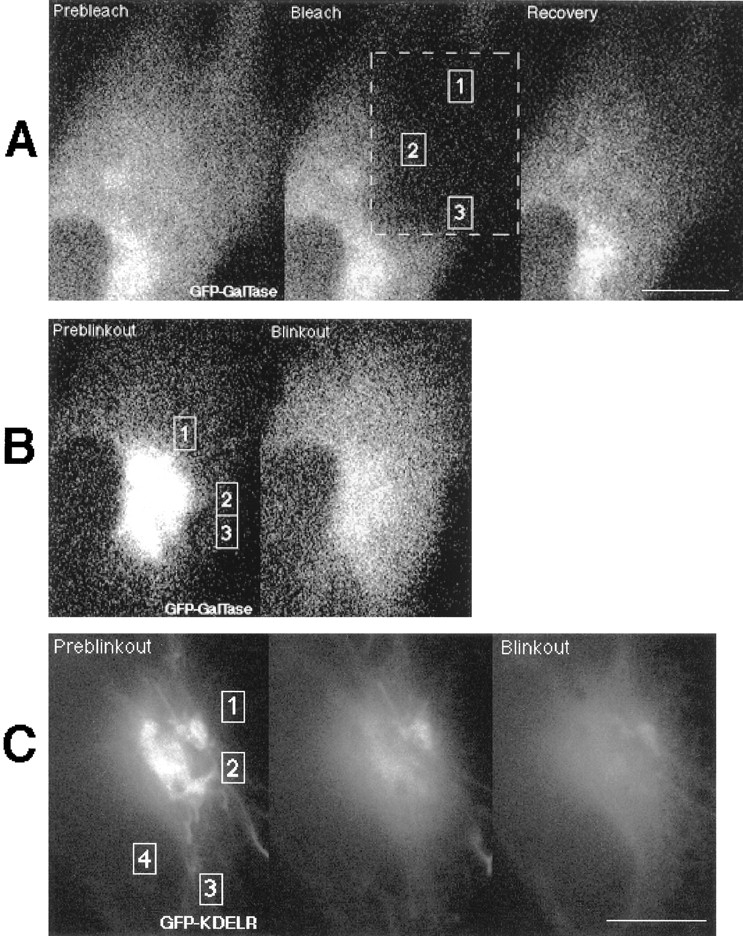
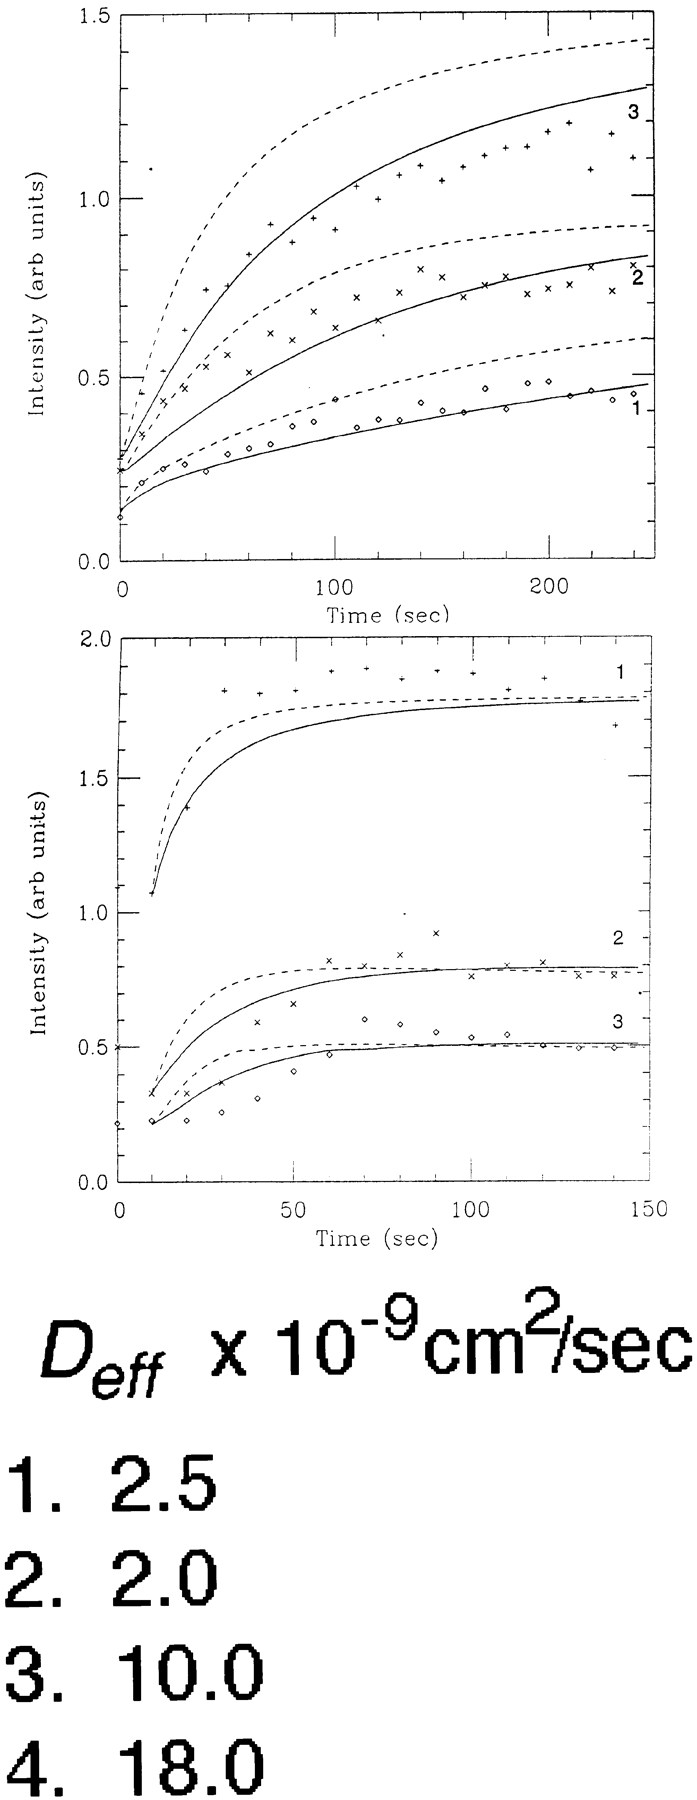
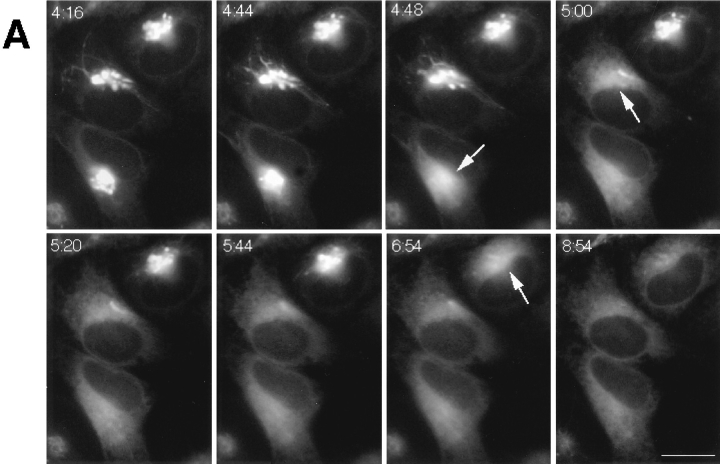
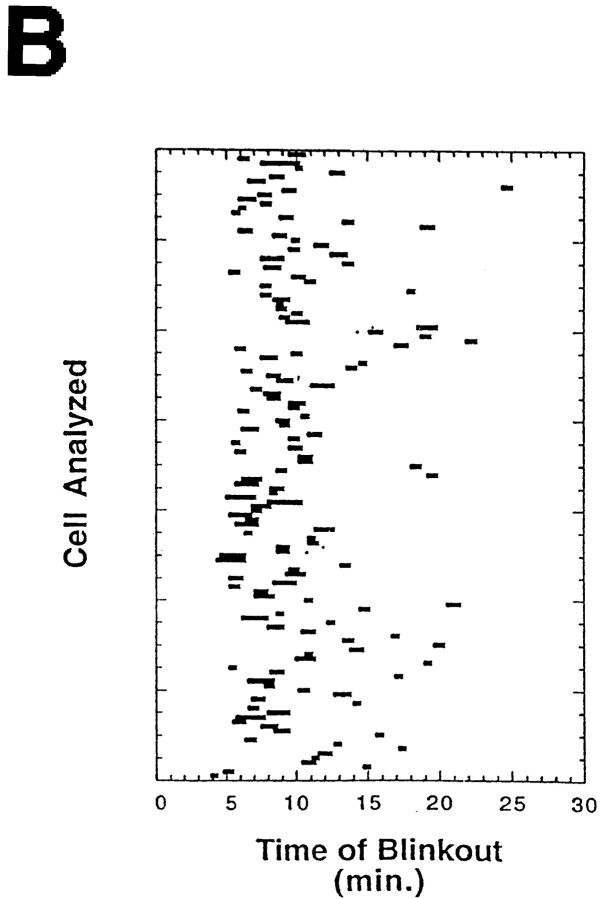
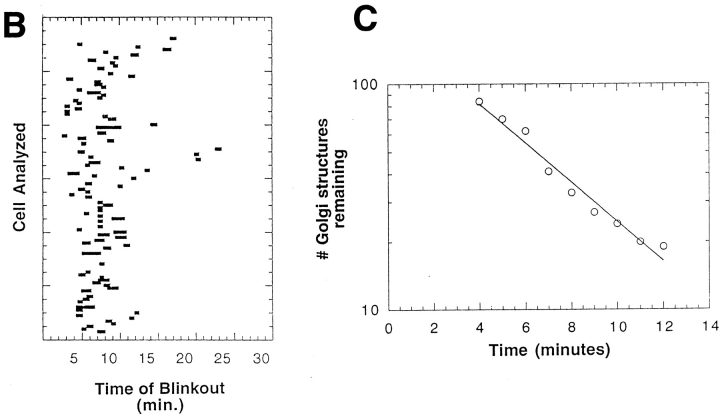
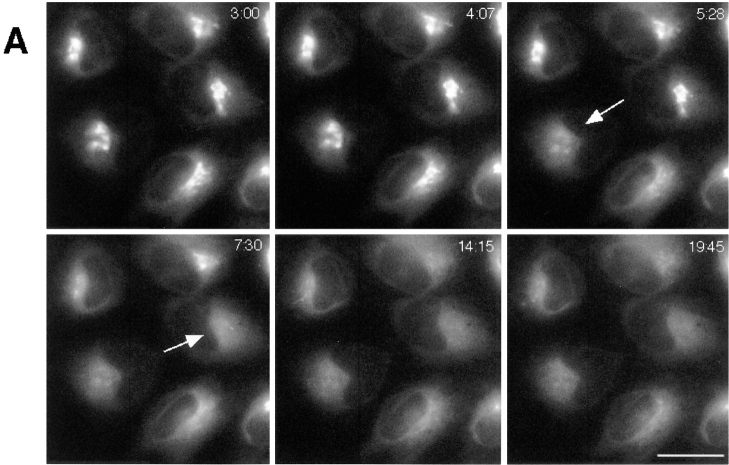
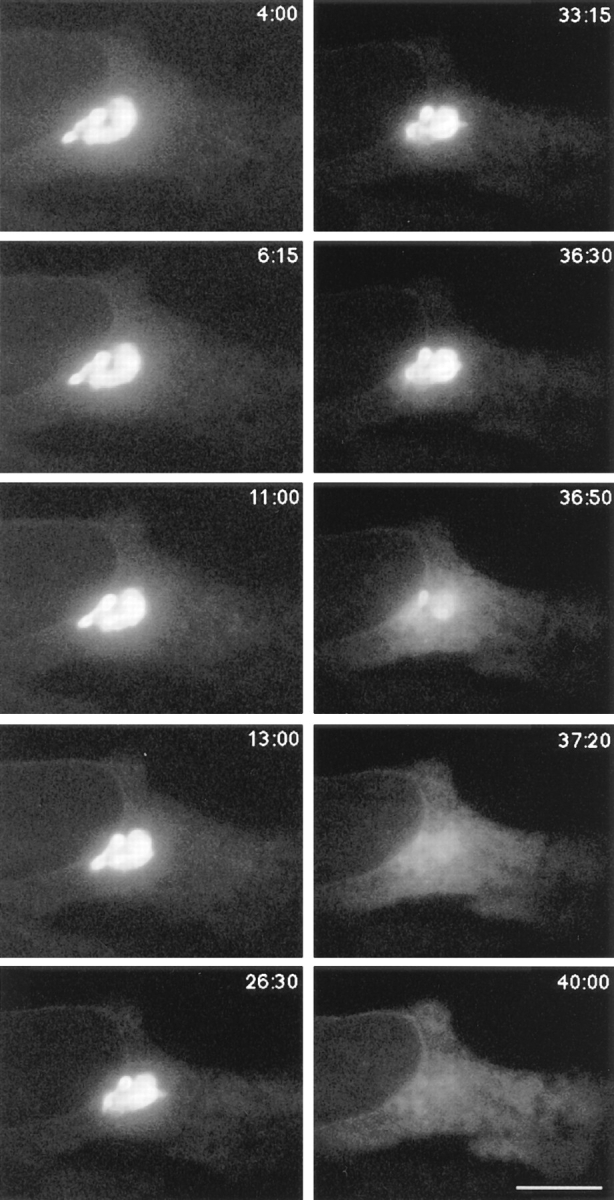
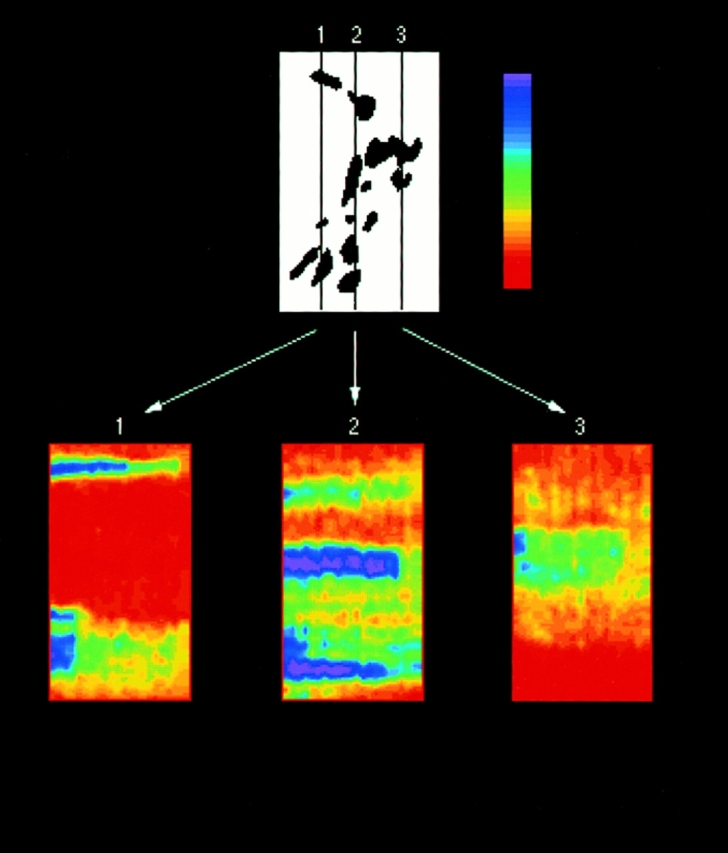
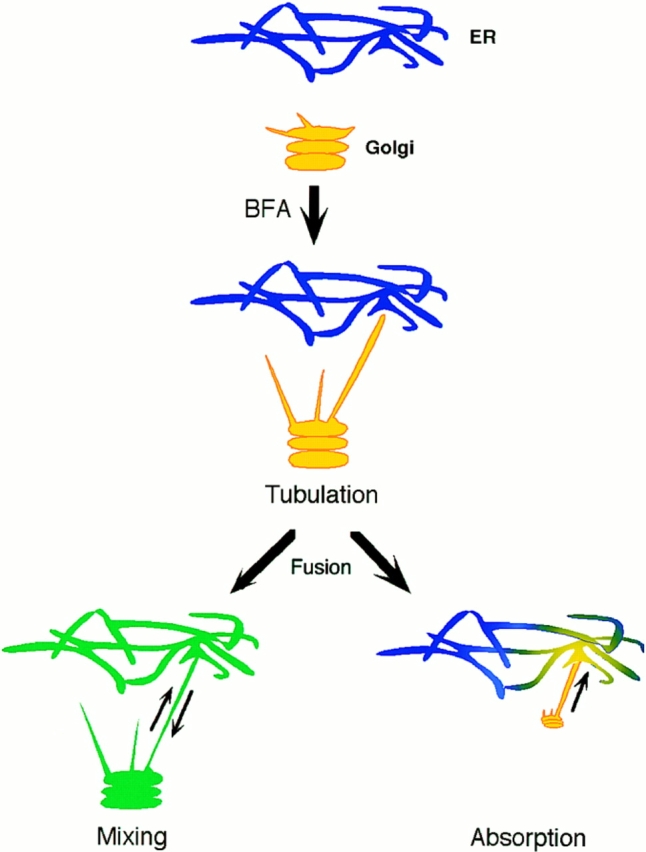
The Golgi complex is a dynamic organelle engaged in both secretory and retrograde membrane traffic. Here, we use green fluorescent protein-Golgi protein chimeras to study Golgi morphology in vivo. In untreated cells, membrane tubules were a ubiquitous, prominent feature of the Golgi complex, serving both to interconnect adjacent Golgi elements and to carry membrane outward along microtubules after detaching from stable Golgi structures. Brefeldin A treatment, which reversibly disassembles the Golgi complex, accentuated tubule formation without tubule detachment. A tubule network extending throughout the cytoplasm was quickly generated and persisted for 5-10 min until rapidly emptying Golgi contents into the ER within 15-30 s. Both lipid and protein emptied from the Golgi at similar rapid rates, leaving no Golgi structure behind, indicating that Golgi membranes do not simply mix but are absorbed into the ER in BFA-treated cells. The directionality of redistribution implied Golgi membranes are at a higher free energy state than ER membranes. Analysis of its kinetics suggested a mechanism that is analogous to wetting or adsorptive phenomena in which a tension-driven membrane flow supplements diffusive transfer of Golgi membrane into the ER. Such nonselective, flow-assisted transport of Golgi membranes into ER suggests that mechanisms that regulate retrograde tubule formation and detachment from the Golgi complex are integral to the existence and maintenance of this organelle.


Figures

Figure 3
Figure 3
Tubule connections and extensions of the Golgi complex. (A and B) A time series of images from HeLa cells expressing GFP-GalTase (A) or GFP-KDELR (B) were collected at 0, 10, and 15 min at 37°C on a confocal microscope. Each image represents an overlay of a set of confocal slices extending the depth of the cell. Short arrows point to thin membrane connections initiating more stable membrane continuities between Golgi elements, while long arrows point to areas of detachment. (C) Single images with the confocal pinhole wide open were collected at 7-s time intervals in GFP-KDELR– expressing cells. Arrows point to thin tubule that rapidly extended off of Golgi rim. Bars, 3 μm.
Figure 4
Figure 4
Formation and detachment of Golgi tubules in untreated cells. GFP-KDELR– expressing HeLa cells were imaged at 3-s time intervals at 37°C on a confocal microscope with the pinhole partly closed and brightness level increased for optimal imaging of tubules (at this brightness level GFP intensity within Golgi elements was saturated). Tubules pulled off from Golgi rims, extended into the cell periphery, and often detached from Golgi elements. Detached Golgi tubules continued to move peripherally. Bar, 3 μm. See Quicktime movie sequence at http://dir.nichd.nih. gov/CBMB/pb4labob.htm.
Figure 2
Figure 2
Double labeling of GFP chimeras with Golgi markers using immunofluorescence microscopy. GFP-GalTase or GFP-KDELR expressing HeLa cells were fixed, permeabilized, and labeled with antibodies to the indicated Golgi proteins followed by secondary antibodies coupled to rhodamine. GFP fluorescence is shown on the left, rhodamine labeling in the middle, and the merged images in the right panels. Yellow indicates regions of overlap. Bar, 3 μm.
Figure 11
Figure 11
Evidence for membrane flow from Golgi to ER: diffusive recovery from photobleach contrasted with the time course of Golgi blinkout. (A) Three confocal images showing photobleaching and recovery of GFP-GalTase in the ER in cells treated with BFA for 1 h. The left panel is the prebleach image, the middle panel is just after the bleach, and the right panel is after recovery. The bleached region is outlined in dashed lines. The fluorescent intensities within the boxed ROIs labeled 1, 2, and 3 during recovery are plotted as symbols to the right (diamonds, crosses, and pluses, respectively). The smooth curves are simulations with D eff of 2.5 × 10⁻⁹cm2/s as explained in the text and A. The dashed curves are the same simulation assuming D eff of 5.0 × 10⁻⁹cm2/s. Note that even though each ROI displayed a different recovery curve, a single D eff of 2.5 × 10⁻⁹cm2/s in the simulations could effectively account for all the experimental data. (B) The same cell as in A was imaged during Golgi blinkout after addition of BFA. The two confocal images correspond to onset of Golgi blinkout and after the redistribution into the ER is complete. The fluorescent intensities within the boxed ROIs labeled 1, 2, and 3 during Golgi blinkout are plotted to the right as symbols (pluses, crosses, and diamonds, respectively). Numerical simulations began with the fluorescent density field shown in the left panel and assumed diffusive transport toward the field in the right panel. The smooth curves in the graph show the simulated intensity assuming D eff of 2.5 × 10⁻⁹cm2/s, whereas the dashed curves show the simulated intensity assuming D eff of 5.0 × 10⁻⁹cm2/s. Note the latency period of the experimental data in relation to the simulated curves and the more sigmoidal rise. (C) Three cooled CCD images of a GFP-KDELR–expressing cell at the beginning of Golgi blinkout (left), 7.4 s later (middle), and the final time point 37 s later (right). Fluorescent intensity values of the four ROIs shown were plotted as a function of time in BFA. Numerical simulations ran from the first panel toward the third as in B. Diffusion constants for each ROI that best fit the data are shown. Bars (A and C), 10 μm.
Figure 11
Figure 11
Evidence for membrane flow from Golgi to ER: diffusive recovery from photobleach contrasted with the time course of Golgi blinkout. (A) Three confocal images showing photobleaching and recovery of GFP-GalTase in the ER in cells treated with BFA for 1 h. The left panel is the prebleach image, the middle panel is just after the bleach, and the right panel is after recovery. The bleached region is outlined in dashed lines. The fluorescent intensities within the boxed ROIs labeled 1, 2, and 3 during recovery are plotted as symbols to the right (diamonds, crosses, and pluses, respectively). The smooth curves are simulations with D eff of 2.5 × 10⁻⁹cm2/s as explained in the text and A. The dashed curves are the same simulation assuming D eff of 5.0 × 10⁻⁹cm2/s. Note that even though each ROI displayed a different recovery curve, a single D eff of 2.5 × 10⁻⁹cm2/s in the simulations could effectively account for all the experimental data. (B) The same cell as in A was imaged during Golgi blinkout after addition of BFA. The two confocal images correspond to onset of Golgi blinkout and after the redistribution into the ER is complete. The fluorescent intensities within the boxed ROIs labeled 1, 2, and 3 during Golgi blinkout are plotted to the right as symbols (pluses, crosses, and diamonds, respectively). Numerical simulations began with the fluorescent density field shown in the left panel and assumed diffusive transport toward the field in the right panel. The smooth curves in the graph show the simulated intensity assuming D eff of 2.5 × 10⁻⁹cm2/s, whereas the dashed curves show the simulated intensity assuming D eff of 5.0 × 10⁻⁹cm2/s. Note the latency period of the experimental data in relation to the simulated curves and the more sigmoidal rise. (C) Three cooled CCD images of a GFP-KDELR–expressing cell at the beginning of Golgi blinkout (left), 7.4 s later (middle), and the final time point 37 s later (right). Fluorescent intensity values of the four ROIs shown were plotted as a function of time in BFA. Numerical simulations ran from the first panel toward the third as in B. Diffusion constants for each ROI that best fit the data are shown. Bars (A and C), 10 μm.
Figure 1
Figure 1
Localization of GFP-GalTase by immunogold microscopy. Gallery of images from cryosections of CHO cells expressing GFP-GalTase (A–C) or GFP-KDELR (D) that were immunostained with anti-GFP antibody and 15-nm colloidal gold protein A. Note that multiple cisternae within Golgi stacks are specifically labeled with gold particles. Nu, nucleus; Pm, plasma membrane. Bars, 0.2 μm.
Figure 5
Figure 5
Tubulation and explosive disassembly of the Golgi complex in BFA-treated cells. GFP-GalTase– expressing HeLa cells treated with BFA were imaged at 4-s time intervals using a cooled CCD microscope system at 37°C. Images shown begin after 4 min (4:00) of BFA treatment and extend until 8 min 57 s (8:57). Tubule formation was accentuated in these cells without tubule detachment. GFP-GalTase rapidly emptied from the Golgi tubular system into the ER over a period of about 14 s beginning at 8 min 33 s (8:33). Thereafter, the GFP label remained dispersed in ER membranes leaving no identifiable Golgi structures behind. Bar, 5 μm. See Quicktime movie sequence at http://dir.nichd.nih.gov/CBMB/pb4labob.htm.
Figure 6
Figure 6
Tubules containing BODIPY-ceramide in BFA-treated cells and their codistribution with GalTase. (A–C) Golgi membranes were labeled with BODIPY-ceramide and then treated with BFA before imaging at 37°C with a cooled CCD microscope system. Images were collected at 0 min (A), 5 min (B), and 10 min (C) after BFA treatment. Note that juxtanuclear Golgi structures labeled by the fluorescent lipid analog tubulated in response to BFA and then dispersed. (D and E) Cells plated on gridded coverslips were labeled with BODIPY-ceramide and imaged 5 min after BFA treatment. The cells were fixed, permeabilized, and then prepared for immunofluorescence using rabbit anti–mouse GalTase antibody followed by rhodamine-labeled goat anti–rabbit IgG. Cells previously imaged in fluorescein optics were located and then reimaged in rhodamine optics to compare the distribution of the two labels. Arrows point to staining of GalTase (E) and BODIPY-ceramide (D) colocalized to the same Golgi tubules in BFA-treated cells. Bars, 10 μm.
Figure 7
Figure 7
Time-course and kinetics of Golgi disassembly in a population of cells treated with BFA. Cells expressing GFP-GalTase were treated with BFA and imaged with a cooled CCD microscope system at 37°C. (A) A field of cells showing redistribution of GFP-GalTase into the ER. Arrows point to Golgi structures undergoing blinkout. Note that Golgi blinkout occurred at different times in different cells. Images shown begin at 4 min 16 s (4:16) of BFA treatment and extend until 8 min 54 s (8:54). (B) Time-lapse sequences were taken as described above with images taken at 13.5-s intervals. Bars show duration (start to finish) of Golgi blinkout. Start of blinkout was the first frame showing spreading of fluorescence. The end was the last frame to show change. (C) The data set in B was replotted to show the number of Golgi structures remaining as a function of time in BFA. The best fit exponential function to the numbers is the line shown on the graph, indicating that the kinetics of Golgi blinkout in a cell population is a first order process. Bar, 10 μm.
Figure 7
Figure 7
Time-course and kinetics of Golgi disassembly in a population of cells treated with BFA. Cells expressing GFP-GalTase were treated with BFA and imaged with a cooled CCD microscope system at 37°C. (A) A field of cells showing redistribution of GFP-GalTase into the ER. Arrows point to Golgi structures undergoing blinkout. Note that Golgi blinkout occurred at different times in different cells. Images shown begin at 4 min 16 s (4:16) of BFA treatment and extend until 8 min 54 s (8:54). (B) Time-lapse sequences were taken as described above with images taken at 13.5-s intervals. Bars show duration (start to finish) of Golgi blinkout. Start of blinkout was the first frame showing spreading of fluorescence. The end was the last frame to show change. (C) The data set in B was replotted to show the number of Golgi structures remaining as a function of time in BFA. The best fit exponential function to the numbers is the line shown on the graph, indicating that the kinetics of Golgi blinkout in a cell population is a first order process. Bar, 10 μm.
Figure 8
Figure 8
Kinetics of disassembly of BODIPY-ceramide–labeled Golgi structures in BFA-treated cells. Cells were labeled with BODIPY-ceramide and treated with BFA. They were then imaged at 37°C using a cooled CCD microscope system. (A) Image sequences of a field of cells from 3 min (3:00) to 19 min 45 s (19:45) of BFA treatment showing redistribution of BODIPY-ceramide from juxtanuclear Golgi structures into the ER. Arrows point to cells that have just undergone blink out. (B) Time-lapse sequences were taken as described above with images collected at 13.5-s intervals. Bars show duration (start to finish) of Golgi blinkout for 110 cells. Start of blinkout was the first frame showing spreading of fluorescence. The end was the last frame to show change. Onset and duration of Golgi blinkout in BODIPY-ceramide– labeled Golgi membranes was indistinguishable from GFP-GalTase–labeled Golgi membranes. (C) The data set in B was replotted to show the number of Golgi structures remaining as a function of time in BFA. The best fit exponential function to the numbers is the line shown on the graph, indicating that the kinetics of Golgi blinkout in a cell population is a first order process. Bar, 10 μm.
Figure 8
Figure 8
Kinetics of disassembly of BODIPY-ceramide–labeled Golgi structures in BFA-treated cells. Cells were labeled with BODIPY-ceramide and treated with BFA. They were then imaged at 37°C using a cooled CCD microscope system. (A) Image sequences of a field of cells from 3 min (3:00) to 19 min 45 s (19:45) of BFA treatment showing redistribution of BODIPY-ceramide from juxtanuclear Golgi structures into the ER. Arrows point to cells that have just undergone blink out. (B) Time-lapse sequences were taken as described above with images collected at 13.5-s intervals. Bars show duration (start to finish) of Golgi blinkout for 110 cells. Start of blinkout was the first frame showing spreading of fluorescence. The end was the last frame to show change. Onset and duration of Golgi blinkout in BODIPY-ceramide– labeled Golgi membranes was indistinguishable from GFP-GalTase–labeled Golgi membranes. (C) The data set in B was replotted to show the number of Golgi structures remaining as a function of time in BFA. The best fit exponential function to the numbers is the line shown on the graph, indicating that the kinetics of Golgi blinkout in a cell population is a first order process. Bar, 10 μm.
Figure 9
Figure 9
Microtubule depolymerization delays onset but not the kinetics of Golgi blinkout in BFA-treated cells. GFP-GalTase– expressing cells were placed on ice for 20 min, and nocodazole (1 μg/ml) was added to depolymerize microtubules (Cole et al., 1996b ). Cells were warmed to 37°C in the presence of BFA. Cells were then imaged at 37°C using a cooled CCD microscope system. Images shown begin at 4 min (4:00) after warm-up and extend until forty min (40:00). Very little change in Golgi morphology at the light microscope level occurred during the first 30 min of BFA treatment, with no tubules observed. Beginning at 36 min 30 s (36:30), however, GFP-GalTase redistributed into the ER, spreading throughout this compartment within 50 s (37:20). Thus, microtubule disruption delays onset of Golgi blinkout but does not affect its rapid kinetics. Bar, 5 μm . See Quicktime movie sequence at http://dir.nichd.nih.gov/CBMB/pb4labob.htm.
Figure 10
Figure 10
Separate BODIPY-ceramide–labeled Golgi elements in the same cell disassemble at different times during BFA treatment. BFA-induced redistribution of Golgi membranes labeled with BODIPY-ceramide were visualized in individual cells using a cooled CCD microscope system. The images were digitized and analyzed on a computer. The entire image set of 22 images (each image 9-s apart) was used to construct three time series (bottom panels 1, 2, and 3) correlating to three vertical line scans through the data set. The distribution of Golgi elements at the start of the experiment is shown in the top panel. The three vertical lines (1, 2, and 3) in this panel show the position of the vertical line scans used to construct the time series shown in color below it. The direction of time in the vertical line series is left to right from 2:40 to 6:09 min. The intensity of the BODIPY-ceramide label was mapped to a color lookup table (upper right) with highest intensities labeled purple and lowest intensities orange. From these images it is evident that distinct BODIPY-ceramide–containing elements (purple) disassemble abruptly and with unique kinetics in cells treated with BFA.
Figure 12
Figure 12
Mixing versus absorption models for Golgi membrane redistribution into the ER in BFA-treated cells. The Poissonian distributed Golgi lifetimes after addition of BFA (Figs. 7 and 8) suggests Golgi redistribution into the ER is initiated by a discrete event, possibly fusion of a single Golgi tubule with the ER. After fusion, redistribution could occur by diffusive mixing of Golgi and ER membranes (bottom left) or by unidirectional absorption of Golgi membrane into the ER (bottom right). Since no significant pool of Golgi lipid or protein remained localized to the Golgi area after Golgi blinkout, the absorption model is favored. Kinetic analysis of Golgi redistribution (Fig. 11) further revealed fluorescent transfer of Golgi protein into and across the ER was too fast to be explained by lateral diffusion within a bilayer and had the characteristics of membrane flow. This suggests Golgi membrane absorption into the ER in BFA-treated cells is mediated by a tension-driven membrane flow. Blue, ER membrane; yellow, Golgi membrane; green, mixed ER–Golgi membranes.

References

    1. Antony C, Cibert C, Geraud G, Santa A, Maria, Maro B, Mayau V, Goud B. The small GTP-binding protein rab6p is distributed from medial Golgi to the trans-Golgi network as determined by a confocal microscopic approach. J Cell Sci. 1992;103:785–796. - PubMed
    1. Allan V, Vale R. Movement of membrane tubules along microtubules in vitro: evidence for specialized sites of motor attachment. J Cell Sci. 1994;107:1885–1897. - PubMed
    1. Balch WE, McCafferey JM, Plutner H, Farquhar MG. Vesicular stomatitis virus glycoprotein is sorted and concentrated during export from the endoplasmic reticulum. Cell. 1994;76:841–852. - PubMed
    1. Banta M, Polizotto RS, Wood SA, de Figueiredo P, Brown WJ. Characterization of a cytosolic activity that induces the formation of Golgi membrane tubules in a cell-free reconstitution system. Biochemistry. 1995;34:13359–13366. - PubMed
    1. Batchelor, G.K. 1967. An Introduction to Fluid Mechanics. Cambridge University Press, Cambridge, UK. 615 pp.

MeSH terms