Comparative Study
. 1997 Dec 1;139(5):1349-60.
doi: 10.1083/jcb.139.5.1349.

Multistep navigation and the combinatorial control of leukocyte chemotaxis

Affiliations
Comparative Study

Multistep navigation and the combinatorial control of leukocyte chemotaxis

E F Foxman et al. J Cell Biol. .

Abstract

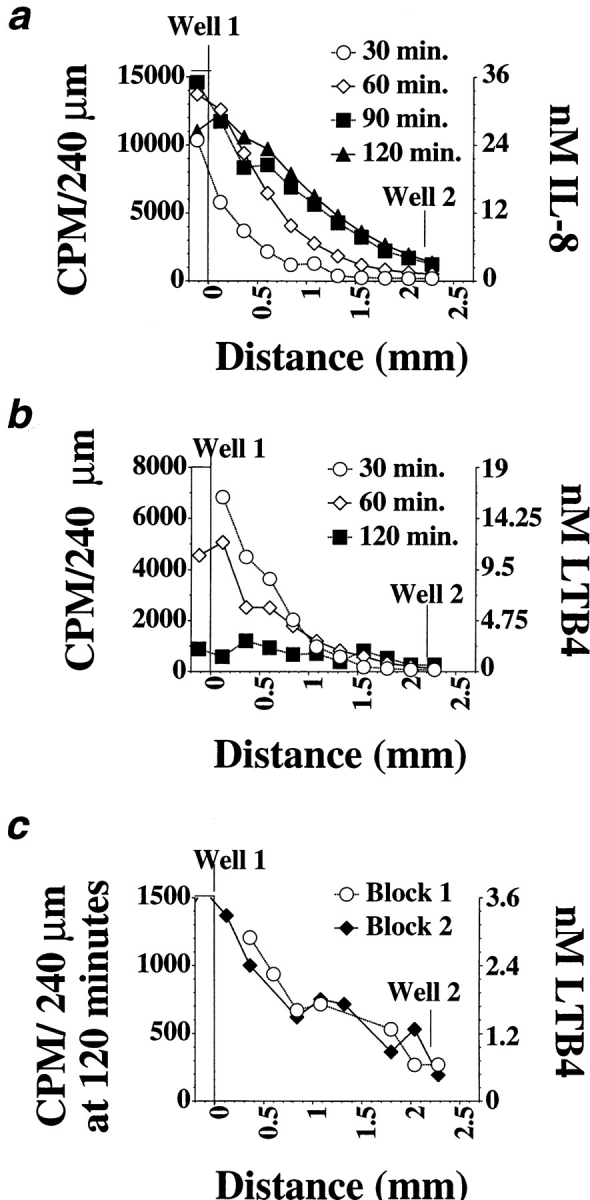
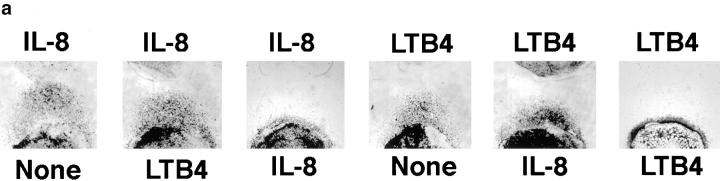
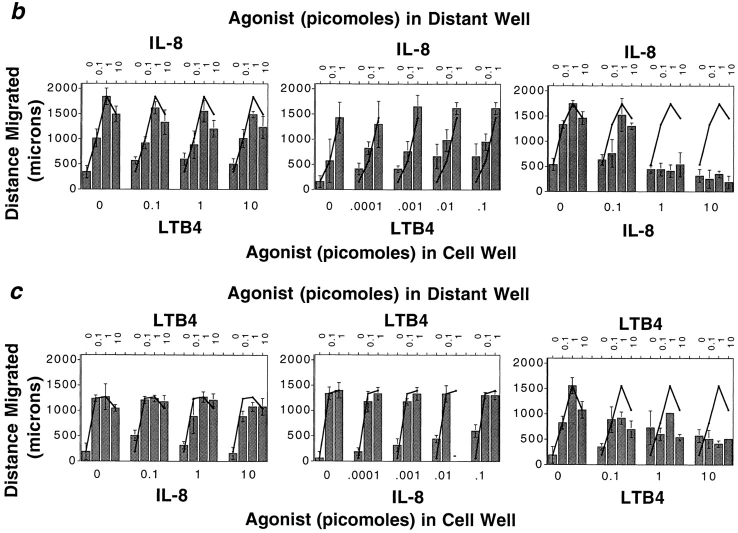
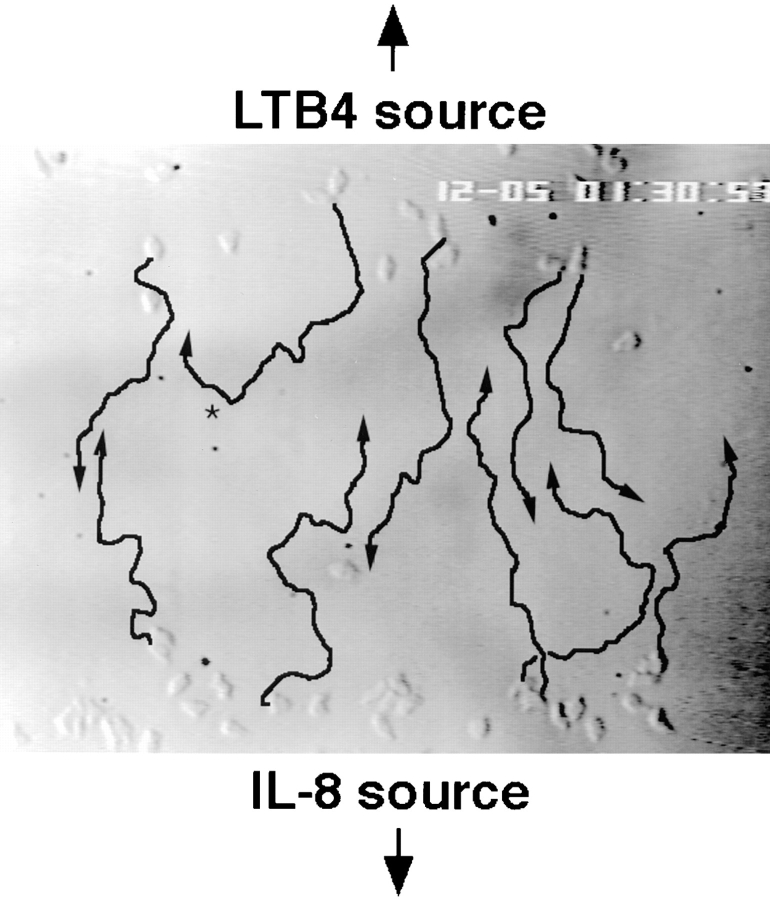
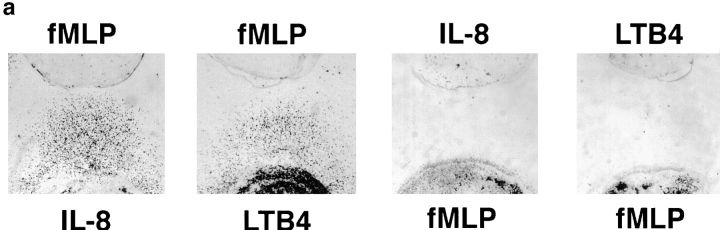
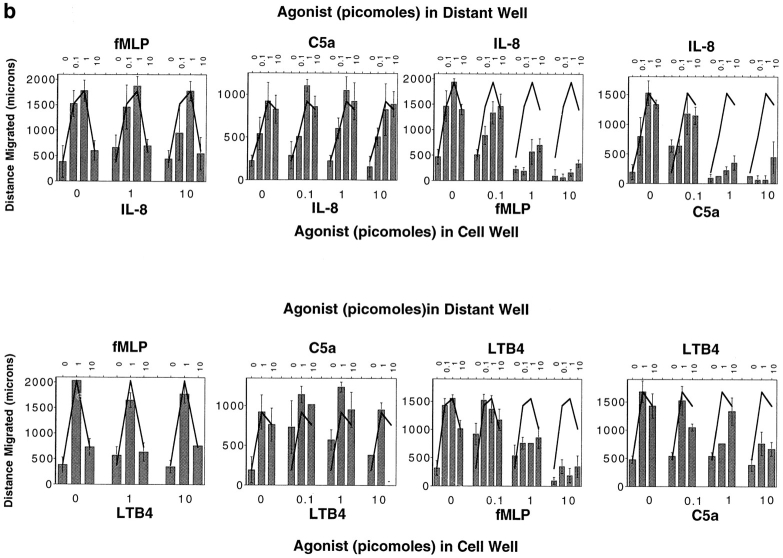
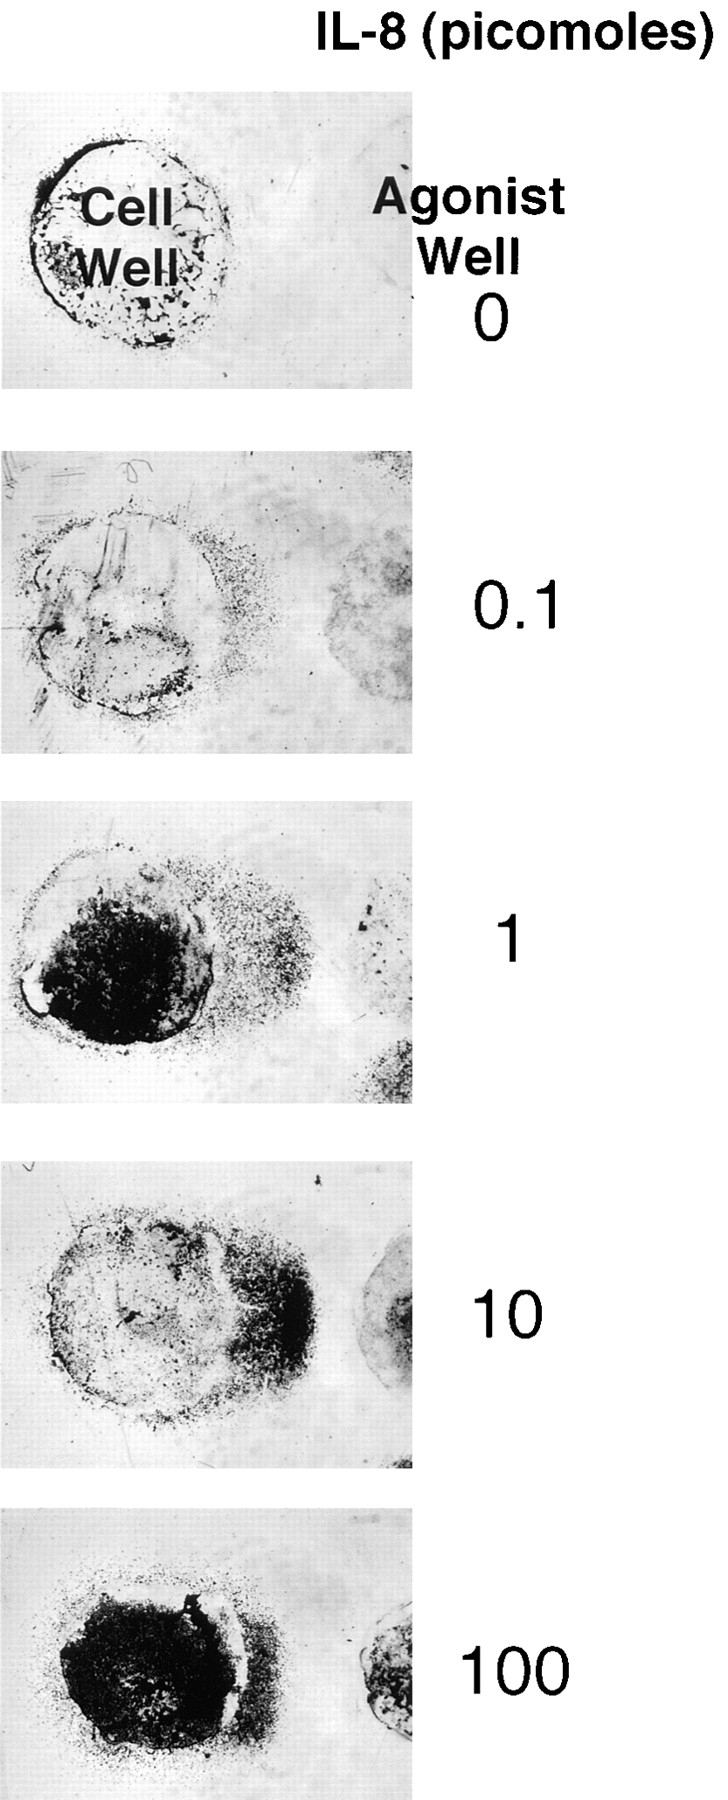
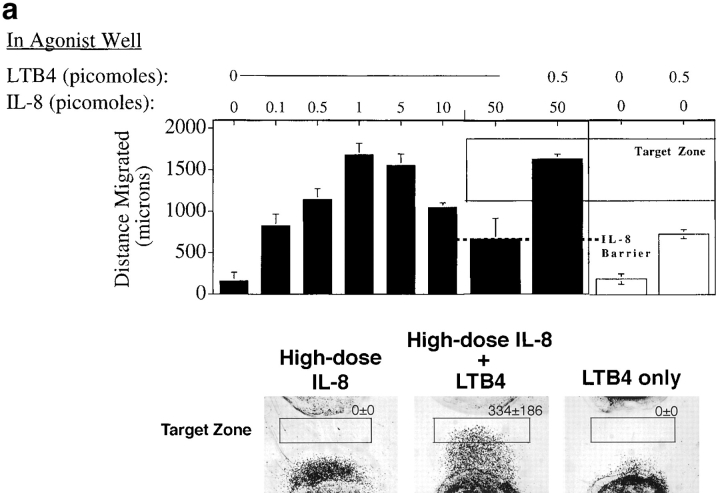
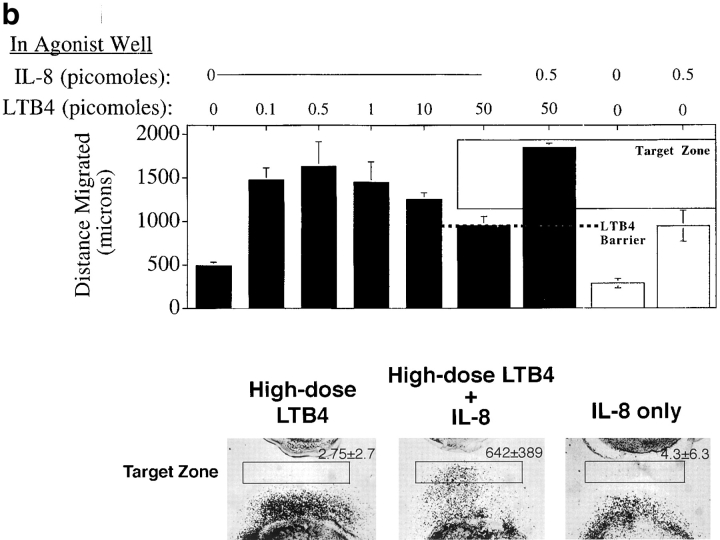
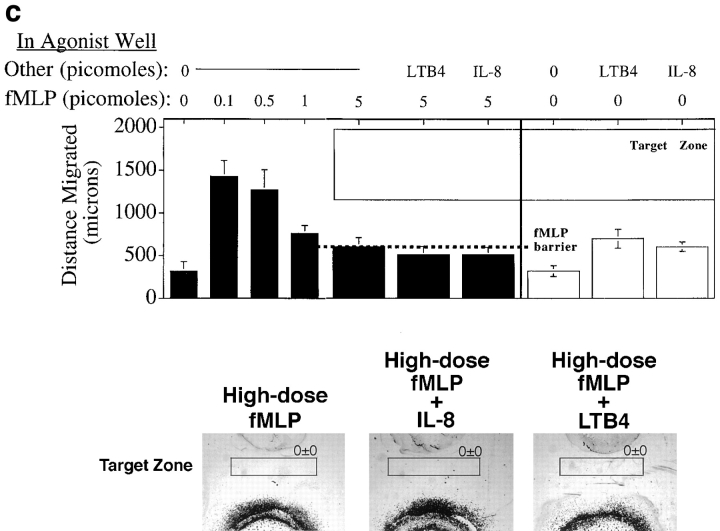
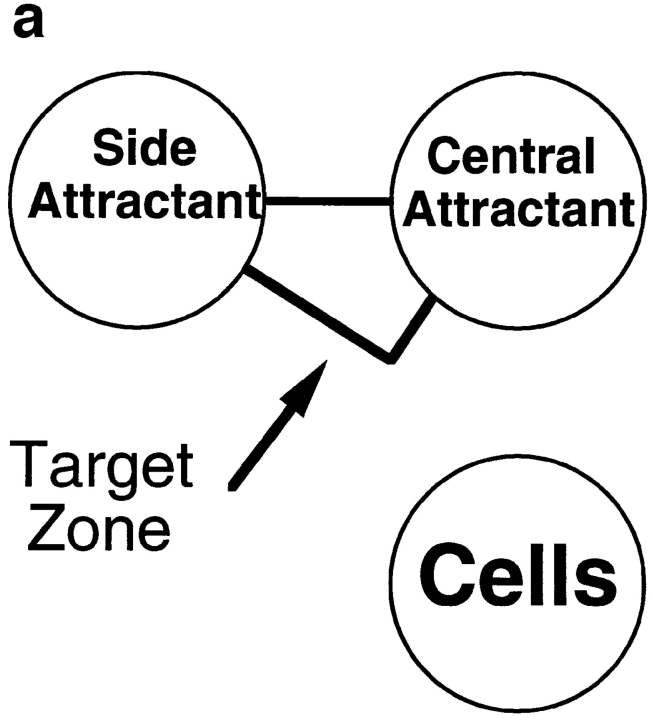
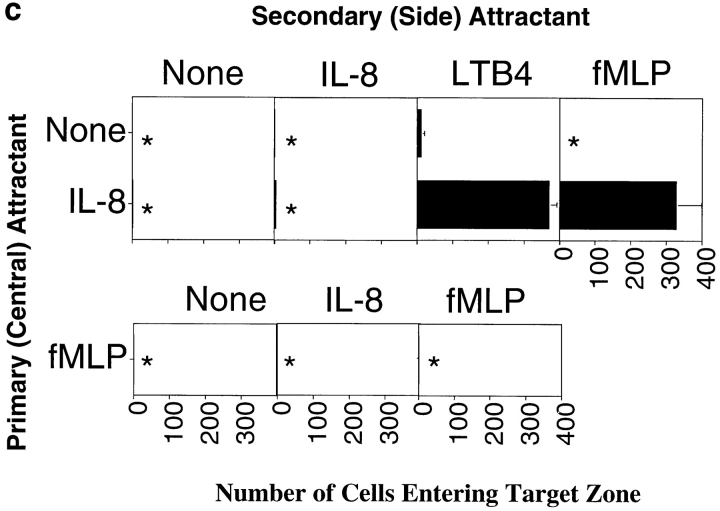
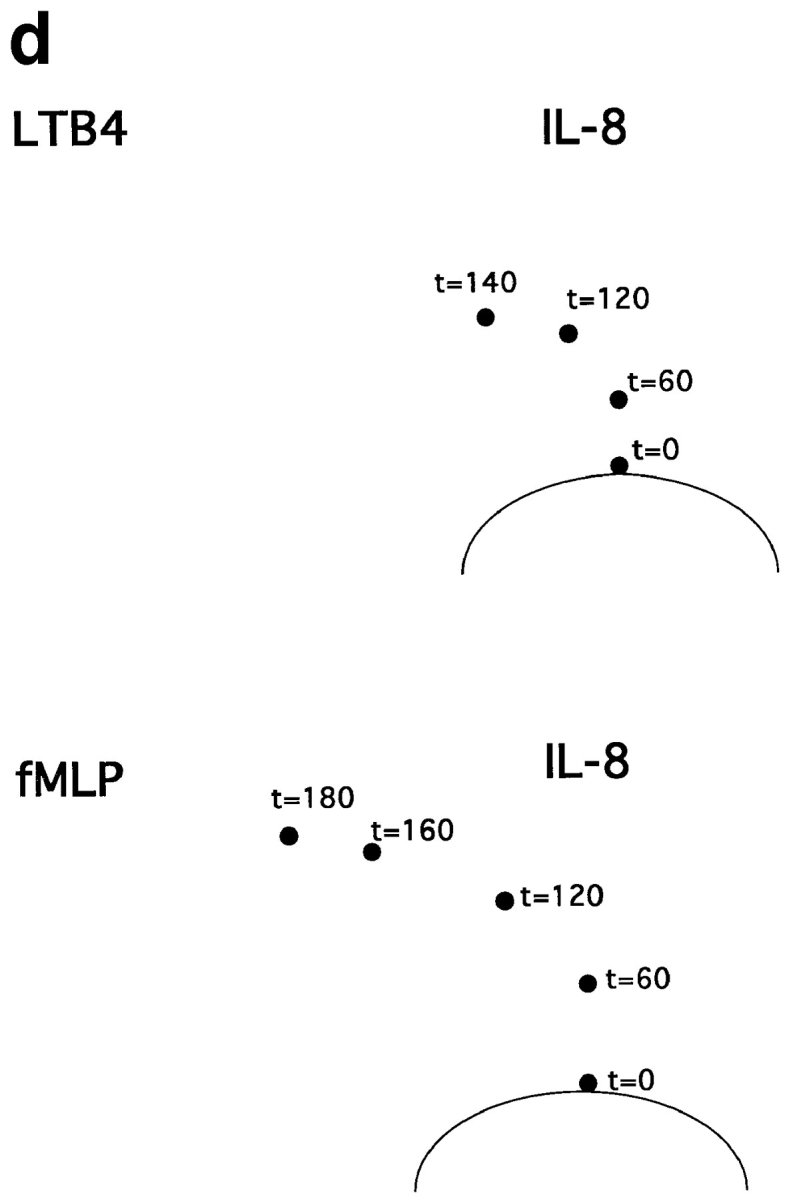
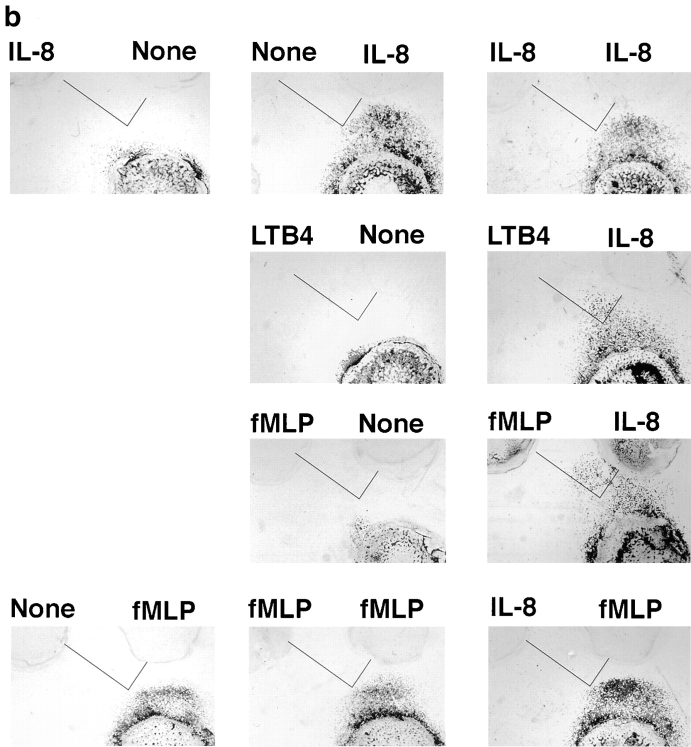
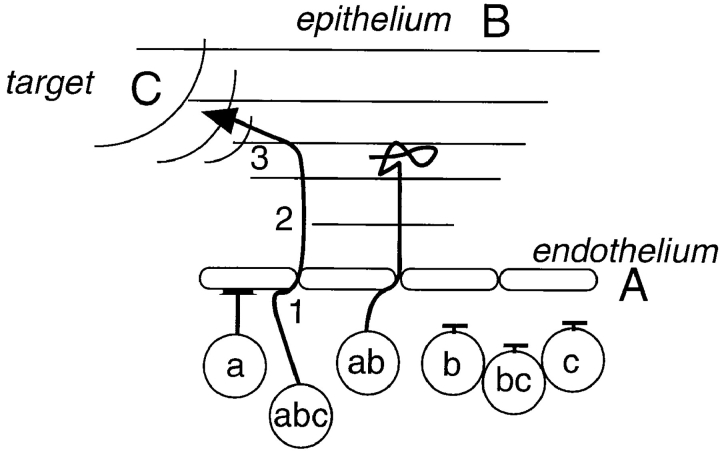
Cells migrating within tissues may encounter multiple chemoattractant signals in complex spatial and temporal patterns. To understand leukocyte navigation in such settings, we have explored the migratory behavior of neutrophils in model scenarios where they are presented with two chemoattractant sources in various configurations. We show that, over a wide range of conditions, neutrophils can migrate "down" a local chemoattractant gradient in response to a distant gradient of a different chemoattractant. Furthermore, cells can chemotax effectively to a secondary distant agonist after migrating up a primary gradient into a saturating, nonorienting concentration of an initial attractant. Together, these observations suggest the potential for cells' step-by-step navigation from one gradient to another in complex chemoattractant fields. The importance of such sequential navigation is confirmed here in a model system in which neutrophil homing to a defined domain (a) requires serial responses to agonists presented in a defined spatial array, and (b) is a function of both the agonist combination and the sequence in which gradients are encountered. We propose a multistep model of chemoattractant-directed migration, which requires that leukocytes display multiple chemoattractant receptors for successful homing and provides for combinatorial determination of microenvironmental localization.


Figures

Figure 2
Figure 2
Gradients formed by IL-8 and LTB4 and calculated agonist concentrations for 1 pmol added in well 1. Each curve shows a representative of at least three determinations of the IL-8 (a) or LTB4 (b) concentration gradients in agarose, 30–120 min after addition of radioactive agonist, using the protocol outlined in the Materials and Methods section. Replicate IL-8 gradient measurements were very consistent in shape and magnitude, whereas LTB4 gradient measurements were more variable, especially in magnitude. The concentrations indicated were calculated for a gradient generated by 1 pmol of agonist. (c) Two replicate determinations of the LTB4 gradient at 120 min.
Figure 1
Figure 1
Neutrophils migrate away from one chemoattractant source towards another. (a) Photographs of stained neutrophils after 2-h migration towards a distant source of LTB4 or IL-8 (1 pmol), in the presence or absence of an inverse gradient generated by LTB4 or IL-8 (10 pmol). Cells placed with one agonist migrate towards the other agonist almost as well as control cells, but do not migrate well towards a distant source of the same agonist. (b) Dose-response curves illustrate that over a wide range of concentrations of both agonists, cells can migrate away from an IL-8 source in response to a target LTB4 gradient; however, cells do not migrate away from a well containing IL-8 (⩾1 pmol) towards a distant IL-8 source. (c) Conversely, over a wide concentration range of close and distant agonists, neutrophils migrate away from an LTB4 source towards IL-8, but not towards LTB4. Each graph in b and c shows the data from a representative experiment of at least two to five performed with similar results. Error bars in b and c indicate the standard deviation of the distance migrated for four replicates.
Figure 1
Figure 1
Neutrophils migrate away from one chemoattractant source towards another. (a) Photographs of stained neutrophils after 2-h migration towards a distant source of LTB4 or IL-8 (1 pmol), in the presence or absence of an inverse gradient generated by LTB4 or IL-8 (10 pmol). Cells placed with one agonist migrate towards the other agonist almost as well as control cells, but do not migrate well towards a distant source of the same agonist. (b) Dose-response curves illustrate that over a wide range of concentrations of both agonists, cells can migrate away from an IL-8 source in response to a target LTB4 gradient; however, cells do not migrate away from a well containing IL-8 (⩾1 pmol) towards a distant IL-8 source. (c) Conversely, over a wide concentration range of close and distant agonists, neutrophils migrate away from an LTB4 source towards IL-8, but not towards LTB4. Each graph in b and c shows the data from a representative experiment of at least two to five performed with similar results. Error bars in b and c indicate the standard deviation of the distance migrated for four replicates.
Figure 3
Figure 3
Neutrophils can migrate in opposite directions in the same field of overlapping chemoattractant gradients. The migratory behavior of neutrophils placed in IL-8 (originating in a well below the picture) and LTB4 (originating in a well above the picture) was recorded by time-lapse video microscopy. The image shows cells at the leading edge of each population 90 min after the start of the assay, when each population is nearing a common point between the starting wells. Arrows indicate the migration paths of several representative cells over the next 15 min. Most cells that started at the IL-8 source migrate towards the LTB4 source and vice versa; occasionally, a cell is observed to change directions (i.e., cell indicated by *).
Figure 4
Figure 4
The migratory behavior of cells originating at a source of fMLP or C5a. (a) Photographs of stained cells after 2-h migration to a source of fMLP, IL-8, or LTB4 (1 pmol). Cells originating in a well containing IL-8 or LTB4 (10 pmol) exhibit robust migration towards fMLP (top row); however, cells placed with fMLP (10 pmol) do not migrate towards IL-8 or LTB4. (b) Dose-response curves show the effect of varying concentrations of fMLP and C5a on migration to IL-8 and LTB4, and the effect of varying amounts of IL-8 and LTB4 on migration to fMLP and C5a. Each graph shows the data from a representative experiment of two to five performed with similar results; error bars indicate the standard deviation of the distance migrated for four replicates.
Figure 4
Figure 4
The migratory behavior of cells originating at a source of fMLP or C5a. (a) Photographs of stained cells after 2-h migration to a source of fMLP, IL-8, or LTB4 (1 pmol). Cells originating in a well containing IL-8 or LTB4 (10 pmol) exhibit robust migration towards fMLP (top row); however, cells placed with fMLP (10 pmol) do not migrate towards IL-8 or LTB4. (b) Dose-response curves show the effect of varying concentrations of fMLP and C5a on migration to IL-8 and LTB4, and the effect of varying amounts of IL-8 and LTB4 on migration to fMLP and C5a. Each graph shows the data from a representative experiment of two to five performed with similar results; error bars indicate the standard deviation of the distance migrated for four replicates.
Figure 5
Figure 5
Dose dependence of neutrophil migration under agarose. Neutrophil responses to a range of IL-8 gradients in the standard 2-h under-agarose migration assay are shown. Neutrophils in the cell well migrate in response to a concentration gradient generated by the indicated amounts of IL-8 in the agonist well. On migrating towards gradients generated by >1 pmol IL-8, the migrating front at the leading edge is flat, and cells are densely packed. The distance cells migrate before arresting in this configuration decreases as the IL-8 concentration in the agonist well increases. All chemoattractants used in this study exhibit a qualitatively similar dose- response curve in this migration assay.
Figure 6
Figure 6
Neutrophils can migrate beyond a high dose barrier of a primary agonist in response to a secondary agonist. (a–c) In a standard migration assay, neutrophils were allowed to migrate towards a gradient generated by an agonist dose high enough (50 pmol IL-8 or LTB4, 5 pmol fMLP) to arrest crawling cells in a flat migrating front at a fixed distance from the agonist well. Halfway through the assay (at 75 min), a lower dose of a second agonist (5 pmol IL-8 or LTB4) was added to the agonist well. The distances cells migrated, in the presence or absence of the second agonist, are graphed in the upper panels as the mean of four replicates, error bars showing the standard error. The dashed line shows the position of the high dose migration barrier. Photographs show cells that have migrated to a first agonist only for 150 min (bottom left), the first agonist for the entire 150 min plus the second agonist for the last 75 min (bottom center), or to the second agonist only for 75 min (bottom right). The number of cells entering a target zone near the agonist well are indicated (mean and range of two replicates from a representative experiment).
Figure 6
Figure 6
Neutrophils can migrate beyond a high dose barrier of a primary agonist in response to a secondary agonist. (a–c) In a standard migration assay, neutrophils were allowed to migrate towards a gradient generated by an agonist dose high enough (50 pmol IL-8 or LTB4, 5 pmol fMLP) to arrest crawling cells in a flat migrating front at a fixed distance from the agonist well. Halfway through the assay (at 75 min), a lower dose of a second agonist (5 pmol IL-8 or LTB4) was added to the agonist well. The distances cells migrated, in the presence or absence of the second agonist, are graphed in the upper panels as the mean of four replicates, error bars showing the standard error. The dashed line shows the position of the high dose migration barrier. Photographs show cells that have migrated to a first agonist only for 150 min (bottom left), the first agonist for the entire 150 min plus the second agonist for the last 75 min (bottom center), or to the second agonist only for 75 min (bottom right). The number of cells entering a target zone near the agonist well are indicated (mean and range of two replicates from a representative experiment).
Figure 7
Figure 7
Neutrophil navigation targeted by sequential migration to chemoattractants in a defined spatial array. (a) Diagram illustrating the position of the two agonist wells relative to the cell well, and the outline of the target zone used to quantitate the number of cells migrating sequentially to both agonists (see c). (b) Photographs of fixed, stained cells that have been allowed to migrate for 3 h in the presence or absence of a central agonist (right side of photos) and/or side agonist (left side of photos). The approximate position of the target zone is indicated in each image (for quantitative analyses, target zones were precisely positioned by a template). Successfully homed cells have been accentuated for illustrative purposes by enhancing the contrast in the target region. The amounts of IL-8, LTB4, and fMLP in the agonist wells were 1 pmol, 1 pmol, and 0.5 pmol, respectively. (c) Graph indicating the number of cells migrating into the defined target zone in presence of various agonist combinations. The mean number of cells entering the target zone is indicated. Error bars show the range for two replicate determinations from a representative experiment. Asterisks indicate that the mean number of cells in the target region was <15. (d) Turning behavior of cells migrating to two agonists in sequence. Dots indicate the center of the leading edge of migrating cells at various times for cells responding to a central IL-8 source and side LTB4 source (top) or a central IL-8 source and side fMLP source (bottom).
Figure 7
Figure 7
Neutrophil navigation targeted by sequential migration to chemoattractants in a defined spatial array. (a) Diagram illustrating the position of the two agonist wells relative to the cell well, and the outline of the target zone used to quantitate the number of cells migrating sequentially to both agonists (see c). (b) Photographs of fixed, stained cells that have been allowed to migrate for 3 h in the presence or absence of a central agonist (right side of photos) and/or side agonist (left side of photos). The approximate position of the target zone is indicated in each image (for quantitative analyses, target zones were precisely positioned by a template). Successfully homed cells have been accentuated for illustrative purposes by enhancing the contrast in the target region. The amounts of IL-8, LTB4, and fMLP in the agonist wells were 1 pmol, 1 pmol, and 0.5 pmol, respectively. (c) Graph indicating the number of cells migrating into the defined target zone in presence of various agonist combinations. The mean number of cells entering the target zone is indicated. Error bars show the range for two replicate determinations from a representative experiment. Asterisks indicate that the mean number of cells in the target region was <15. (d) Turning behavior of cells migrating to two agonists in sequence. Dots indicate the center of the leading edge of migrating cells at various times for cells responding to a central IL-8 source and side LTB4 source (top) or a central IL-8 source and side fMLP source (bottom).
Figure 8
Figure 8
Combinatorial regulation of chemotaxis. Leukocyte homing during step-by-step navigation is determined by the combination and sequence of agonists and receptors engaged. In this example, a cell requires receptor a to acquire motile properties and transmigrate through the endothelium in response to agonist A; receptor b to respond to a gradient from an overlapping epithelial surface that draws the cell into the tissue; and receptor c to detect a signal from its end target, and migrate there. Only cells displaying all three receptors can successfully home to the target region. The same receptors and agonists, displayed in different patterns and/or in combination with other receptors, could participate in a variety of different leukocyte targeting scenarios. This schematic emphasizes that simultaneous expression of multiple receptors is required for homing, and demonstrates how receptors that are displayed relatively indiscriminately (by overlapping subsets of leukocytes) can elicit a specific homing pattern when used in combination.

References

    1. Becker S, Quay J, Koren HS, Haskill JS. Constitutive and stimulated MCP-1, Gro-alpha, beta, and gamma expression in human airway epithelium and bronchoalveolar macrophages. Am J Physiol. 1994;266:278–286. - PubMed
    1. Besemer J, Hujber A, Kuhn B. Specific binding, internalization, and degradation of human neutrophil activating factor by human polymorphonuclear leukocytes. J Biol Chem. 1989;264:17409–17415. - PubMed
    1. Butcher EC. Leukocyte-endothelial cell recognition: three (or more) steps to specificity and diversity. Cell. 1991;67:1033–1036. - PubMed
    1. Campbell JJ, Foxman EF, Butcher EC. Chemoattractant receptor crosstalk as a regulatory mechanism in leukocyte adhesion and migration. Eur J Immunol. 1997;27:2571–2578. - PubMed
    1. Chenoweth DE, Rowe JG, Hugli TE. A modified method for chemotaxis under agarose. J Immunol Methods. 1979;25:337–353. - PubMed

Publication types

MeSH terms