. 1997 Dec 1;11(23):3168-81.
doi: 10.1101/gad.11.23.3168.

Mediation of NGF signaling by post-translational inhibition of HES-1, a basic helix-loop-helix repressor of neuronal differentiation

Affiliations

Mediation of NGF signaling by post-translational inhibition of HES-1, a basic helix-loop-helix repressor of neuronal differentiation

A Ström et al. Genes Dev. .

Abstract

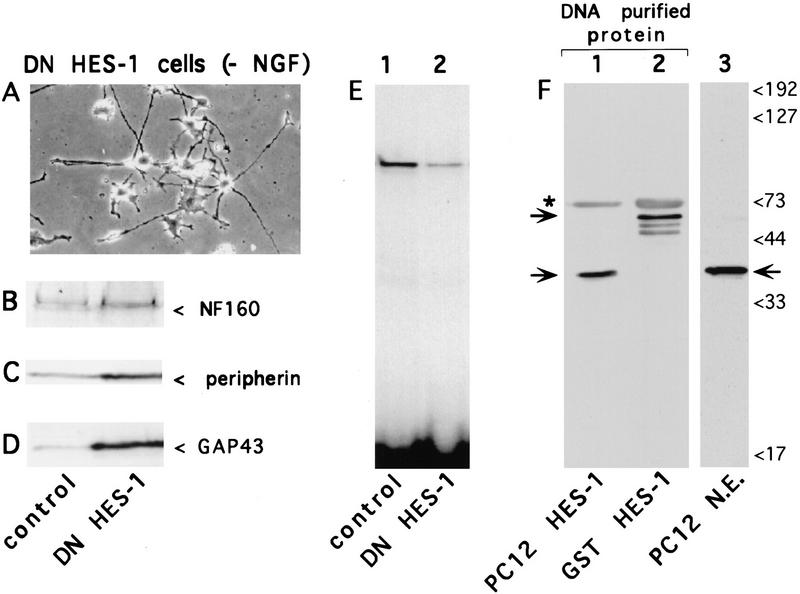
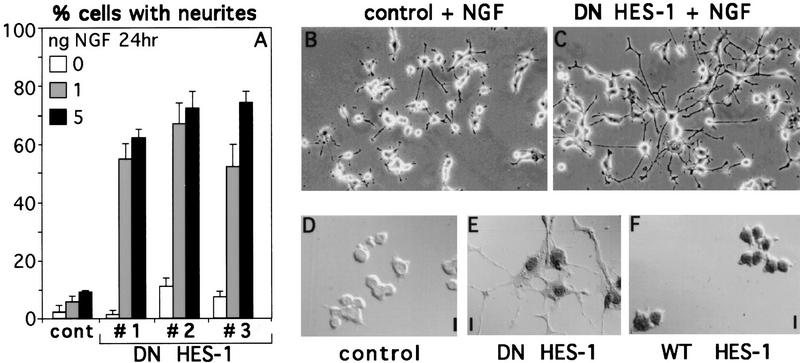
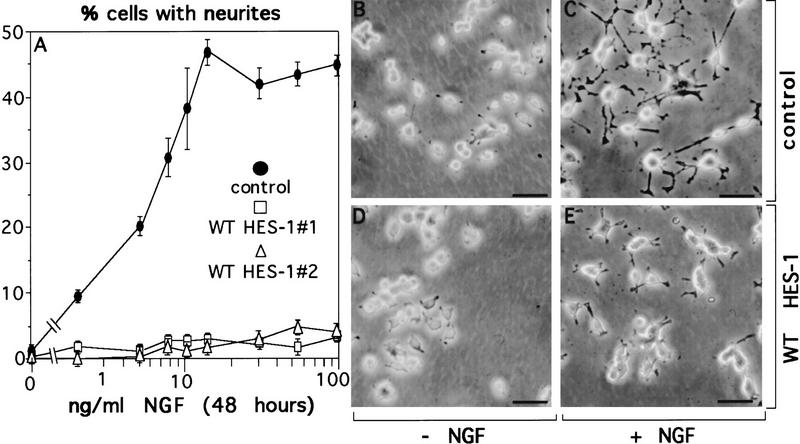
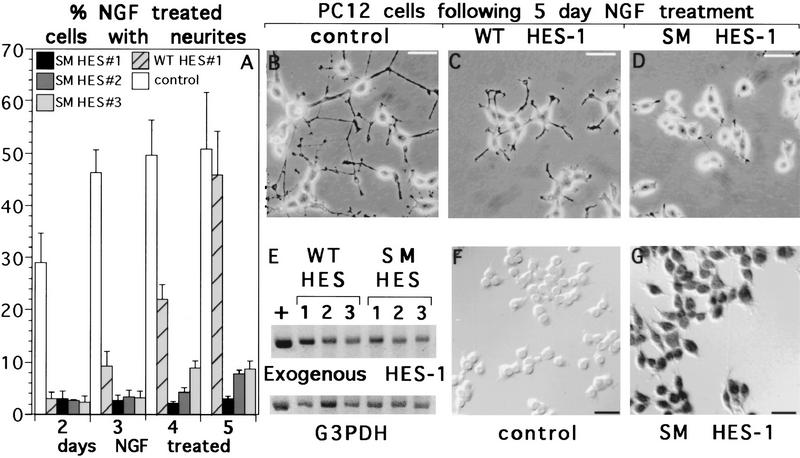
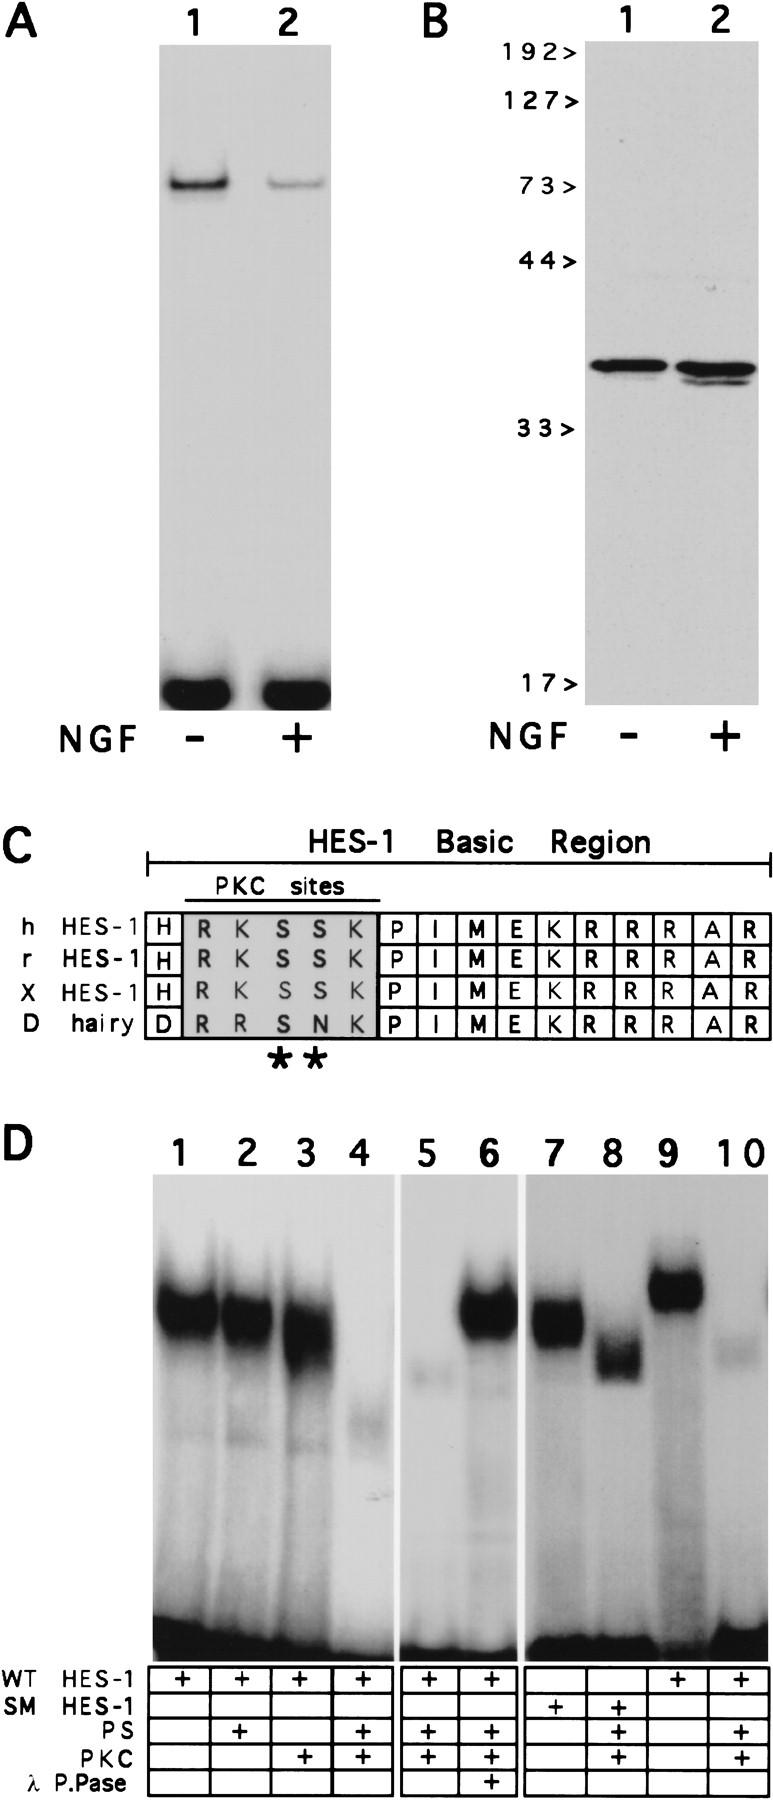
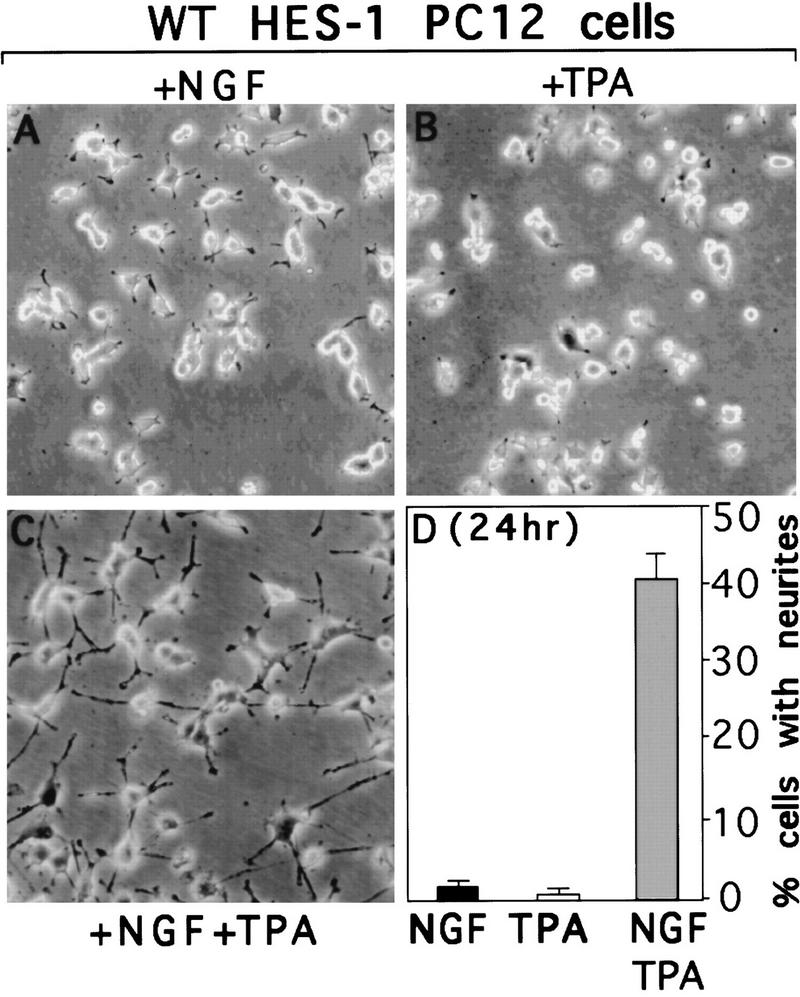
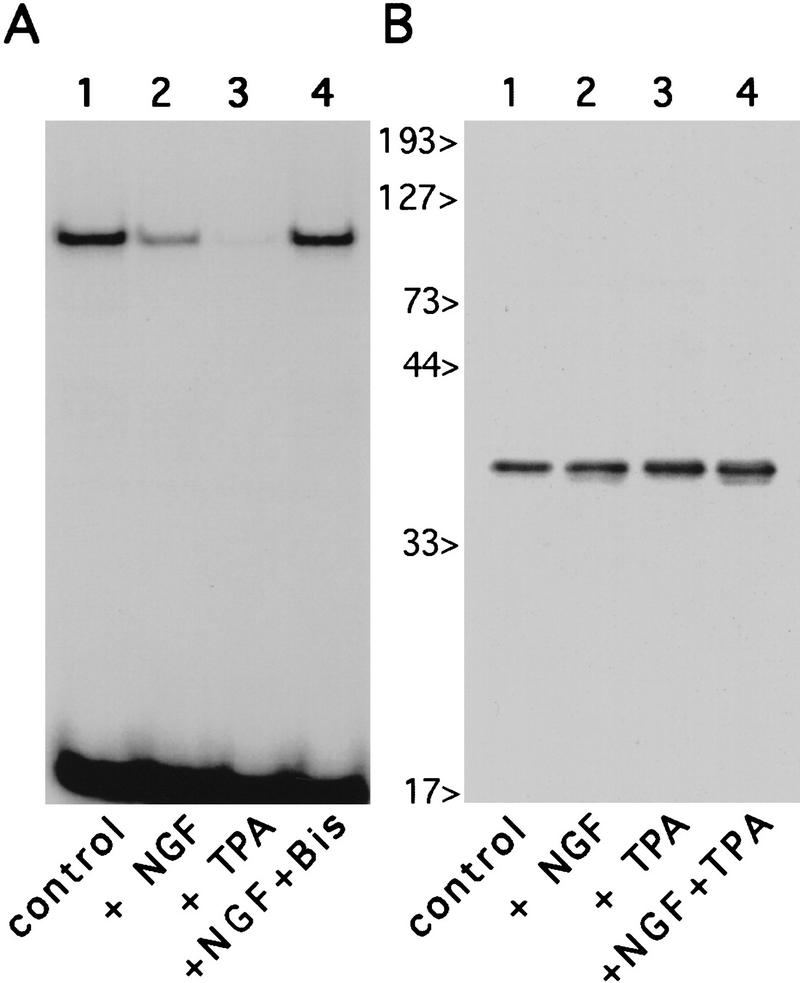
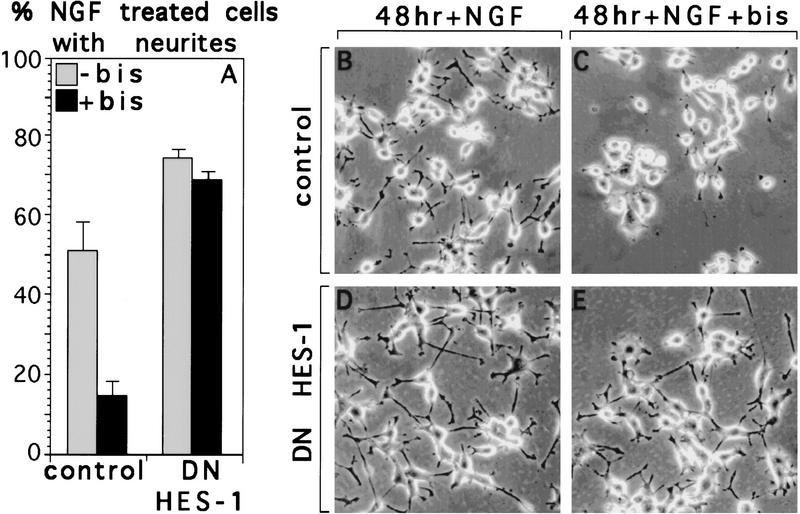
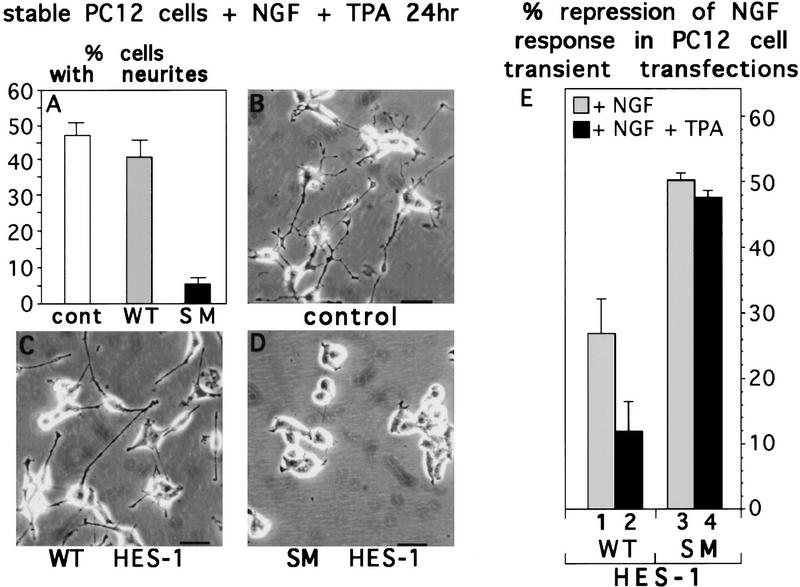
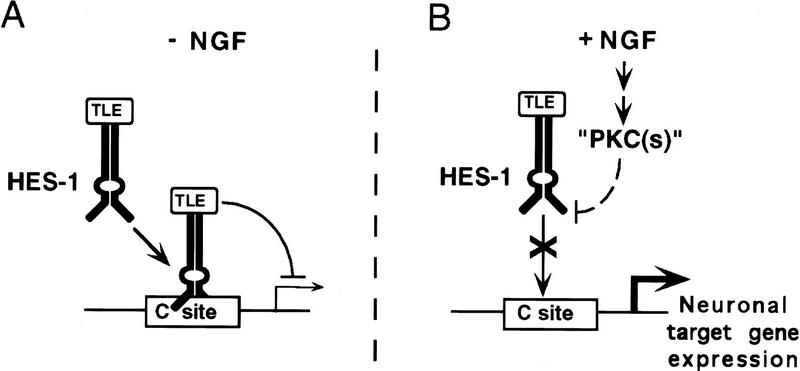
The induction of neurite outgrowth by NGF is a transcription-dependent process in PC12 cells, but the transcription factors that mediate this process are not known. Here we show that the bHLH transcriptional repressor HES-1 is a mediator of this process. Inactivation of endogenous HES-1 by forced expression of a dominant-negative protein induces neurite outgrowth in the absence of NGF and increases response to NGF. In contrast, expression of additional wild-type HES-1 protein represses and delays response to NGF. Endogenous HES-1 DNA-binding activity is post-translationally inhibited during NGF signaling in vivo, and phosphorylation of PKC consensus sites in the HES-1 DNA-binding domain inhibits DNA binding by purified HES-1 in vitro. Mutation of these sites generates a constitutively active protein that strongly and persistently blocks response to NGF. These results suggest that post-translational inhibition of HES-1 is both essential for and partially mediates the induction of neurite outgrowth by NGF signaling.


Figures

Figure 1
Figure 1
Induction of neurite outgrowth in the absence of NGF by cells expressing DN HES-1. (A) Phase-contrast micrograph of cells from a stably transfected DN HES-1 clone. In contrast to control cells (Fig. 2D) many DN HES-1-expressing cells extend neurites in the absence of NGF. (B–D) Western blot analysis comparing neuronal marker protein expression in equal amounts of total protein from control and DN HES-1 expressing cells; (B) neurofilament 160 kD (NF 160), (C) peripherin, (D) GAP-43. (E) Gel-retardation assay comparing the level of endogenous repressor-specific (class C) DNA-binding activity in nuclear extracts from control cells to DN HES-1 cells, normalized to total protein. (F) Confirmation that the endogenous class C-binding complex contains HES-1. Class C binding proteins in PC12 nuclear extracts (N.E.) were affinity purified using a biotinylated Class C DNA probe; Western blot analysis of the DNA-purified protein using an anti-HES-1 antibody (kindly provided by Drs. J. Feder and Y.N. Jan) revealed a band (indicated by lower arrow on left side, lane 1) that comigrated with the anti-HES-1-labeled band present in nuclear extracts (indicated by arrow, lane 3). A DNA-purification positive control, using bacterially expressed GST HES-1 fusion protein in a parallel reaction, is evident as a higher molecular mass band (indicated by upper arrow on left side, lane 2) with characteristically observed degradation products. The upper band in lanes 1 and 2 (indicated by asterix) and not present in lane 3, is probably streptavidin protein eluted from the streptavidin beads during the purification.
Figure 2
Figure 2
Increased response to NGF in DN HES-1-expressing cells. (A) Three stable DN HES-1 clones (1–3) show increased response to low amounts of NGF (1 or 5 ng/ml for 24 hr) relative to control cells. This is a representative graph from a triplicate experiment that was repeated five times. The error is the standard deviation of the mean. (B,C) DN HES-1-expressing cells (C) also showed a much greater length of neurites than did the control cells (B) when exposed to NGF. (D–F) Clones from both the DN HES-1 (E) and WT HES-1 (F) transfected cells showed HA/T7 epitope-tagged protein expression and nuclear localization, whereas no staining was evident in control cells (D).
Figure 3
Figure 3
Decreased response to NGF in WT HES-1-expressing cells. (A) NGF response is greatly repressed in cells expressing WT HES-1 (▵ and □, two WT HES-1 stable clones) compared to stable control cells (•) after 48 hr of treatment with NGF 100 ng/ml. This is a representative graph from triplicate experiments that were repeated four times. The error is the standard deviation of the mean. (B) Control PC12 stable cells without NGF. (C) Control PC12 stable cells treated with 100 ng/ml of NGF for 48 hr extend neurites. (D) HES-1 expressing stable PC12 cells without NGF. (E) HES-1 expressing stable PC12 cells treated with 100 ng/ml of NGF for 48 hr do not significantly respond to NGF.
Figure 9
Figure 9
Persistent block of NGF response in SM HES-1-, but not WT HES-1-expressing cells. (A) The neurite outgrowth response of control, WT HES-1, and SM HES-1 cells was analyzed over 5 days of exposure to NGF. WT HES-1 stable cells have essentially no neurite outgrowth response to 100 ng/ml of NGF at 2 days of exposure (also see Fig. 2), but by 5 days they have regained a similar response in terms of percent cells with neurites. In contrast, three stable SM HES-1 PC12 clones do not respond substantially to NGF after 5 days of exposure. This graph shows data from two independent experiments performed in triplicate, the error bars are the standard deviation of the mean. (B–D) Although the percentage of cells bearing neurites after 5 days of NGF treatment is similar to that of control cells (B), the extent of the neurites in WT HES-1 cells (C) is substantially reduced. The SM HES-1 cells exhibit essentially no neurite outgrowth (D). (E) Semiquantitative RT–PCR of glycerol-3-phosphate dehydrogenase (G3PDH) (input control) and exogenous HES-1 reveals an equivalent level of expression between the WT and SM HES-1 cell lines, indicating that the difference in response is attributable to mutation of the basic region serines. The numbers above the bands correspond to the clones analyzed in panel A, the plus sign is a cDNA control. (F,G) Immunohistochemical staining with antibodies against the T7 and HA epitopes on the exogenous SM HES-1 proteins reveals consistent nuclear expression of these proteins in the SM HES-1 stable PC12 lines (G) and an absence of staining in the control cells (F).
Figure 4
Figure 4
Post-translational inhibition of HES-1 DNA binding activity in vivo and in vitro. (A,B) Post-translational inhibition of endogenous HES-1 DNA binding during NGF signaling. (A) HES-1 DNA-binding activity in nuclear extracts from control PC12 cells (lane 1) and PC12 cells treated with 100 ng/ml of NGF for 24 hr (lane 2). (B) Anti-HES-1 Western blot analysis of the same PC12 nuclear extracts, showing that the level of endogenous HES-1 protein in PC12 cell nuclear extracts (lane 1) is not decreased after 24 hr of NGF treatment (lane 2). (C) Sequence alignment of the DNA-binding domains (basic regions) from the human, rat and Xenopus HES-1 homologs, together with Drosophila hairy. The HES-1 homologs each contain two adjacent serines within PKC consensus phosphorylation sites (*) in the basic region. (D) Inhibition of purified HES-1 protein DNA-binding activity by PKC in vitro. (Lanes 1–4) Incubation of purified, bacterially expressed and HES-1 bHLH domain with PKC results in inactivation of HES-1 DN- binding activity in a phosphotidyl serine (PS)-dependent manner. (Lanes 5,6) Subsequent addition of lambda protein phosphatase (lane 6) restores DNA-binding activity to PKC-treated HES-1 (lane 5). (Lanes 7–10) Treatment of SM HES-1 with PKC does not inhibit DNA-binding activity (cf. lane 7 with lane 8), whereas PKC does inhibit WT HES-1 DNA-binding activity (cf. lane 9 with lane 10). SM HES-1 protein migrates differently than WT HES-1 on native gels (lanes 7,9), despite being identical to the WT HES-1 with the exception of the two basic region serine residues; both migrate identically on SDS-PAGE. Also, phosphorylation of an additional PKC site present in the loop region of HES-1 apparently makes SM HES-1 protein run faster than unphosphorylated protein (lane 8).
Figure 5
Figure 5
TPA induced restoration of NGF response to WT HES-1-expressing cells by activation of endogenous PKCs. (A) WT HES-1-expressing cells do not extend neurites after 24 hr of exposure to 100 ng/ml of NGF. (B) WT HES-1-expressing cells do not extend neurites after 24 hr of exposure to TPA. (C) TPA cotreatment for 24 hr restores a normal NGF response to WT HES-1-expressing cells. (D) Quantitation of the degree of neurite outgrowth observed in the NGF, TPA, and NGF+TPA treated WT HES-1-expressing cells. This is a representative graph of a triplicate experiment that was repeated five times. The error is the standard deviation of the mean. Although not shown, the percentage of HES-1 cells with neurites at the 24-hr +NGF time point was 3.6% ± 0.9%, significantly less than the control cell value of 23.1% ± 1.6%. Also, the control cells exhibited a potentiated response to TPA plus NGF, which can be seen in Figure 8, A and B.
Figure 6
Figure 6
Inhibition of endogenous HES-1 DNA binding during NGF- and PKC-dependent signaling. Gel-shift analysis of PC12 nuclear extracts, using a C class DNA probe, reveals that endogenous HES-1 DNA-binding activity is strongly inhibited after a 24-hr treatment with the PKC activator TPA (A, lane 3), relative to equal amounts of untreated control extract (A, lane 1). The NGF-induced decrease in HES-1 DNA binding (A, lane 2), is blocked by coaddition of the PKC inhibitor bisindolylmaleimide (A, lane 4). Western blot analysis of PC12 nuclear extracts blotted with anti-HES-1 antibody (B) reveals that, as in the case for NGF (lane 2, also see Fig. 4B), the loss of HES-1 DNA binding is not attributable to a reduction in protein levels after treatment with TPA (lane 3), or TPA plus NGF (lane 4).
Figure 7
Figure 7
NGF response is not inhibited by the PKC inhibitor bisindolylmaleimide (bis) in DN HES-1-expressing PC12 cells. Response of control cells (B) to 48 hr of NGF (50 ng/ml) is greatly reduced by addition of bisindolylmaleimide (4 μm) (C), whereas the NGF response in DN HES-1 cells in the presence of bisindolylmaleimide (E) is only slightly reduced compared to that in NGF alone (D). This effect is quantitated in the graph shown in A, which is the average of two independent experiments with the error as the standard deviation of the mean.
Figure 8
Figure 8
TPA restores the NGF response to WT HES-1 but not SM HES-1-overexpressing cells. (A) Quantitation of the percentage of cells from the control, WT HES-1, and SM HES-1 stably transfected clones that have neurites after 24 hr of NGF + TPA treatment. This is a representative graph from triplicate experiments repeated three times. (B) Response of control stably transfected cells to treatment with NGF + TPA for 24 hr. (C) Response of WT HES-1-expressing cells to NGF + TPA is similar to that of control cells. (D) SM HES-1-expressing cells do not extend neurites in response to NGF + TPA treatment. (E) Neurite outgrowth response of PC12 cells transfected transiently with equal amounts of the same expression plasmids as above, plus a β-galactosidase reporter vector, in the presence of NGF alone or NGF plus TPA. The percentage of transfected cells (identified by β-galactosidase activity) with neurites was determined, from which the percent repression of neurite outgrowth for the WT HES-1 and SM HES-1 transfected cells was calculated relative to the corresponding control value (taken as 0% repression). The data shown are from two independent sets of triplicate experiments, the error is the standard deviation of the mean. WT HES-1-transfected cells exhibited a significantly lower repression of NGF-induced neurites in the presence of TPA (∼27% repression without TPA, ∼12% with TPA). SM HES-1-transfected cells, in contrast, exhibited nearly identical percent repression of neurites in both NGF (50%) and NGF + TPA (46%), indicating that SM HES-1 repression activity is insensitive to TPA induced activation of endogenous PKCs. The SM HES-1 transfected cells also exhibited higher repression of neurites than WT HES-1-transfected cells in either NGF (50% vs. 27%) or NGF + TPA (46% vs. 12%). The observation that transiently transfected cells are not all completely repressed at this time point, unlike WT HES-1 stable cells, may relate to the degree and timing of HES-1 expression; in particular the relationship between the timing of transient transfection to the start of NGF treatment and the cell cycle stages of these cells.
Figure 10
Figure 10
Model for the induction of neurite outgrowth through NGF through post-translational inhibition of endogenous HES-1. (A) In the absence of NGF (−NGF), endogenous HES-1 binds to class C sites in target neuronal differentiation genes and actively represses transcription. DNA-bound HES-1 actively represses target gene transcription by recruiting a TLE corepressor, as shown previously (see Discussion). (B) During NGF signaling, post-translational inhibition of HES-1 DNA-binding activity by phosphorylation of the HES-1 basic region results in derepression of target gene transcription, thus mediating the induction of neurite outgrowth and differentiation. The phosphorylation of HES-1 during NGF signaling requires the activation of one or more endogenous PKC or PKC-like kinase (“PKCs”), which phosphorylates directly or indirectly the consensus PKC sites in the HES-1 basic region.

References

    1. Ausubel FM, Brent R, Kingsston RE, Moore DD, Seidman JG, Smith JA, Struhl K. Current protocols in molecular biology. second ed. New York, NY: Greene Publishing Associates and John Wiley & Sons; 1988.
    1. Bar-Sagi D, Feramisco JR. Microinjection of the ras oncogene protein into PC12 cells induces morphological differentiation. Cell. 1985;42:841–848. - PubMed
    1. Benezra R, Davis RL, Lockshon D, Turner DL, Weintraub H. The protein Id: A negative regulator of helix-loop-helix DNA binding proteins. Cell. 1990;61:49–59. - PubMed
    1. Borgatti P, Mazzoni M, Carini C, Neri LM, Marchisio M, Bertolaso L, Previati M, Zauli G, Capitani S. Changes of nuclear protein kinase C activity and isotype composition in PC12 cell proliferation and differentiation. Exp Cell Res. 1996;224:72–78. - PubMed
    1. Burstein DE, Blumberg PM, Greene LA. Nerve growth factor-induced neuronal differentiation of PC12 pheochromocytoma cells: Lack of inhibition by a tumor promoter. Brain Res. 1982;247:115–119. - PubMed

Publication types

MeSH terms