. 1997 Dec 15;17(24):9423-32.
doi: 10.1523/JNEUROSCI.17-24-09423.1997.

Identification of two nervous system-specific members of the erg potassium channel gene family

Affiliations

Identification of two nervous system-specific members of the erg potassium channel gene family

W Shi et al. J Neurosci. .

Abstract

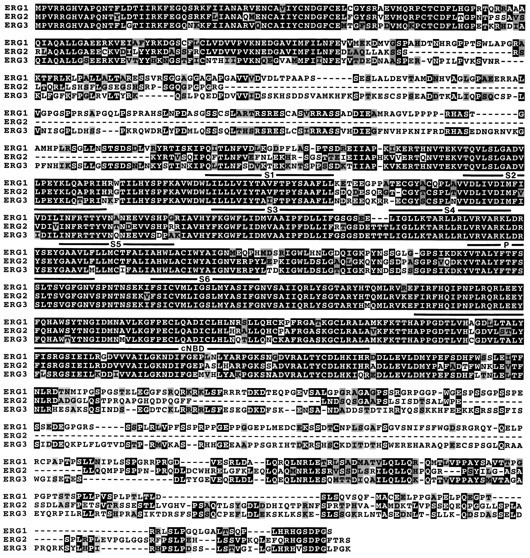
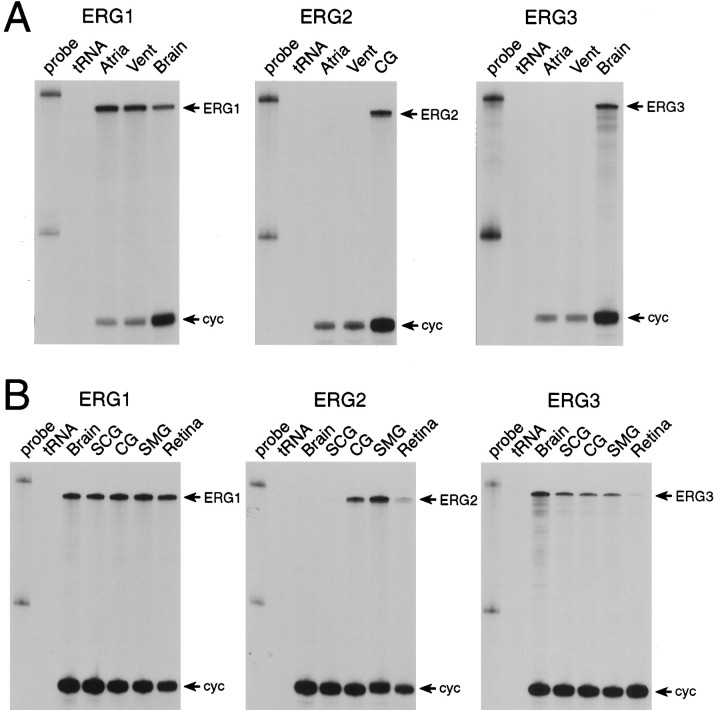
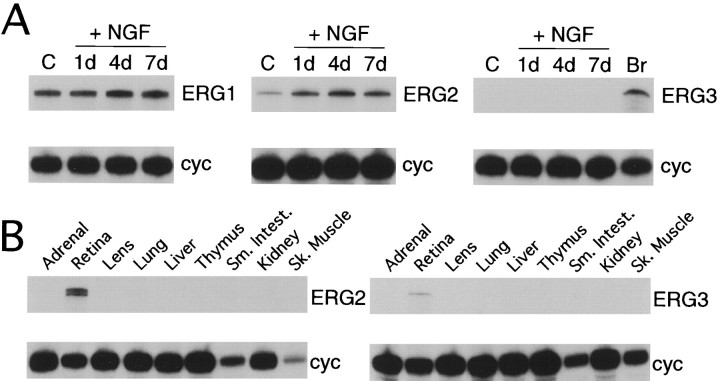
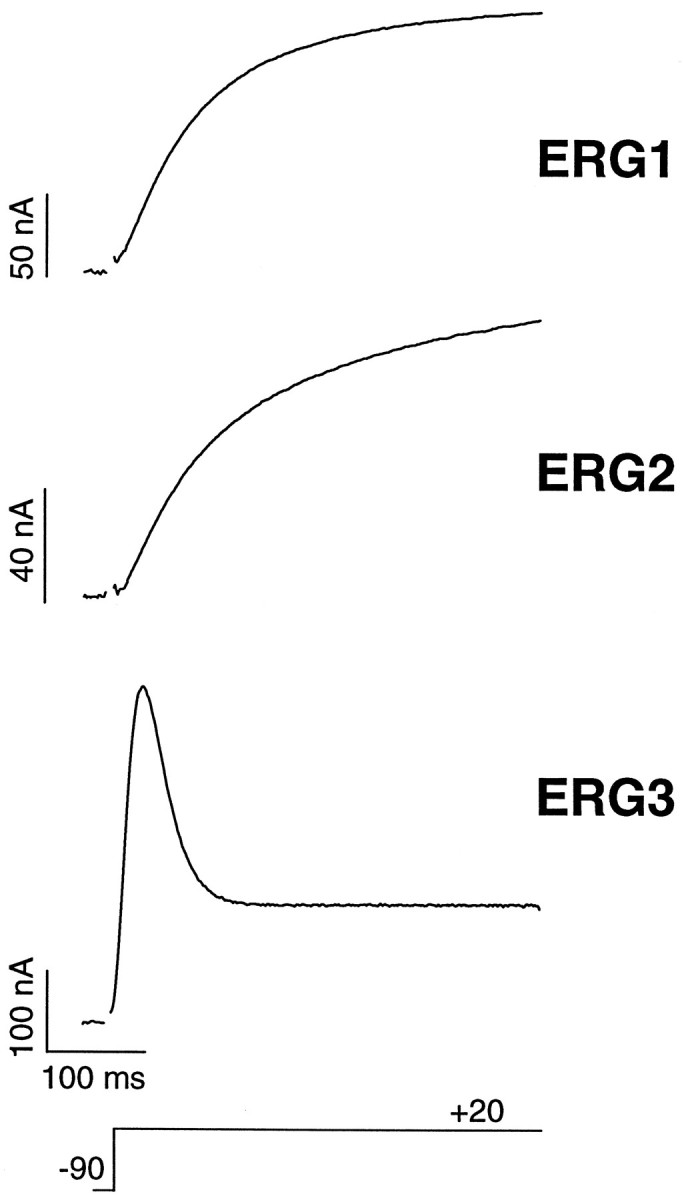
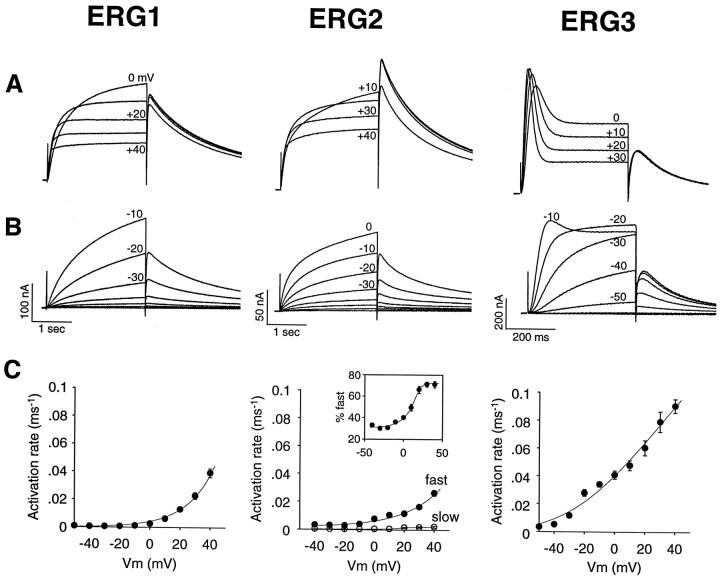
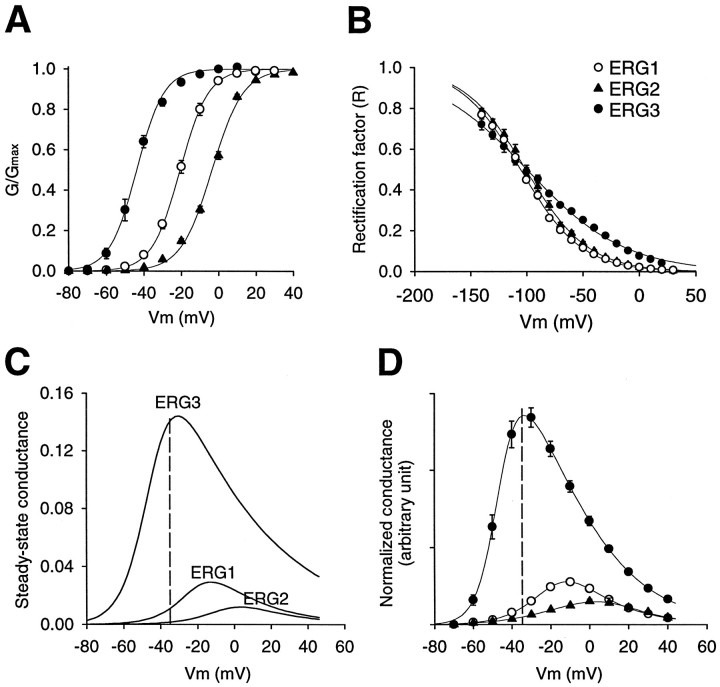
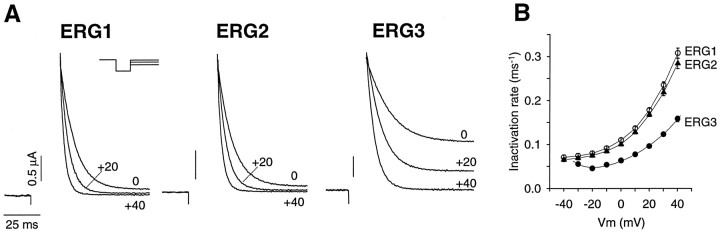
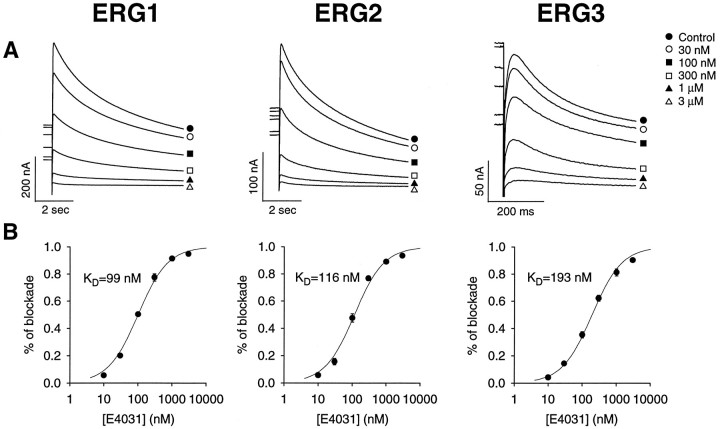
Two new potassium channel genes, erg2 and erg3, that are expressed in the nervous system of the rat were identified. These two genes form a small gene family with the previously described erg1 (HERG) gene. The erg2 and erg3 genes are expressed exclusively in the nervous system, in marked contrast to erg1, which is expressed in both neural and non-neural tissues. All three genes are expressed in peripheral sympathetic ganglia. The erg3 channel produces a current that has a large transient component at positive potentials, whereas the other two channels are slowly activating delayed rectifiers. Expression of the erg1 gene in the sympathetic nervous system has potential implications for the etiology of the LQT2 form of the human genetic disease long QT syndrome.


Figures

Fig. 1.
Fig. 1.
Alignment of the erg1,erg2, and erg3 deduced amino acid sequences. There is 63% identity between erg2 anderg1, 57% identity between erg3 anderg1, and 61% identity between erg2 anderg3. Residues that are identical in all three sequences are shown with black shading, residues identical in two sequences are shown with dark gray shading, similar residues are shown with light gray shading, and nonconserved residues are shown without shading. Theerg1 sequence corresponds to the humanerg gene (Warmke and Ganetzky, 1994). Theerg2 and erg3 sequences are from rat. The six hydrophobic domains (S1–S6), the pore (P), and the putative cyclic nucleotide binding domain (cNBD) are overlined.
Fig. 2.
Fig. 2.
erg potassium channel mRNA expression in heart and neural tissues determined by RNase protection analysis. A, Neither erg2 norerg3 mRNA is expressed at detectable levels in atrial or ventricular (Vent) muscle, in marked contrast toerg1, which is abundant in both tissues (arrows). The positive control samples are celiac ganglia (CG) or brain mRNA. B, All threeerg genes are expressed in neural tissue. Samples tested were brain, superior cervical ganglia (SCG), celiac ganglia (CG), superior mesenteric ganglia (SMG), and retina. The cyclophilin gene (cyc, arrows) was used as an internal positive control; as has been shown previously, cyclophilin expression was always lower in muscle tissues, as compared with other tissues.
Fig. 3.
Fig. 3.
erg potassium channel mRNA expression in PC12 cells and non-neural tissues determined by RNase protection analysis. A, erg mRNA expression in PC12 cells in control media or after 1, 4, or 7 d of treatment with nerve growth factor (NGF). Brain (Br) mRNA was used as a positive control for theerg3 experiment. B, Expression oferg2 and erg3 mRNA in non-neural tissues. Retinal RNA was used as the positive control.
Fig. 4.
Fig. 4.
Current responses of the erg1,erg2, and erg3 channels to a depolarizing voltage step. The holding potential was −90 mV, and the step was to +20 mV. Recordings were from Xenopus oocytes and were performed with two-electrode voltage clamp. Current records were leakage-subtracted, and the capacitance artifact at the beginning of the voltage step was blanked.
Fig. 5.
Fig. 5.
Activation rates of the erg1,erg2, and erg3 channels.A, B, Current traces showing channel activation and deactivation in response to voltage steps to various potentials from a holding potential of −90 mV. Tail currents were recorded at −70 mV. Note the much faster time scale forerg3 as compared with the erg1 anderg2 channels. Current records were leakage-subtracted.C, Comparison of the activation rates of theerg1, erg2, and erg3 channels. Activation rates were measured as the inverse of the time constant of single or double exponentials fit to the current traces. A single exponential gave a good fit for erg1. Forerg2, two exponentials were required, and the fraction of the fast component is shown in the inset. Forerg3, activation was clearly sigmoidal at negative potentials. In these cases the activation time course was fit with a single exponential after a delay, to allow for direct comparison with the other two channels. Data are averages from seven or eight cells; error bars are SEM.
Fig. 7.
Fig. 7.
Steady-state kinetic properties of theerg1, erg2, and erg3 channels. A, Peak conductance–voltage curves were measured by stepping to the test potential from a holding potential of −90 mV, followed by a step back to the holding potential. The sizes of the tail currents after recovery from inactivation were used as a measure of channel activation during the test step. The step duration was 5 sec for erg1 and erg2 and 1 sec forerg3. Data points are the average of seven or eight cells and were fit with the Boltzmann equation:G/Gmax = 1/(1 + exp ((VVh)/kh)), where Vh = −21 ± 1.0, −3.5 ± 0.6, and −44 ± 1.4 mV and kh = −7.6 ± 0.4, −8.3 ± 0.3, and −7.2 ± 0.2 mV forerg1, erg2, and erg3, respectively. The open circle representserg1, the filled triangle representserg2, and the filled circle representserg3. B, Rectification factor or steady-state inactivation curve. This was measured by using a protocol similar to that described previously (Sanguinetti et al., 1995). Channels were fully activated by stepping to +40 mV for 1 sec. Then the fully activated I–V relationship was determined by stepping back to various test potentials. Tail currents were extrapolated back to t = 0 to correct for deactivation where necessary. Slope conductance was determined from theI–V plot between −140 and −120 mV, and then the rectification factor was calculated with the following formula:R =I/(Gslope(VmEK)), where R is the rectification factor. Data points are the average of three or four cells and were fit with the Boltzmann equation.Vh = −101 ± 2.4, −105 ± 0.3, and −100 ± 3.0 mV and kh = 28 ± 0.7, 27 ± 0.2, and 43 ± 1.2 mV for erg1,erg2, and erg3, respectively.C, Calculated steady-state conductance–voltage curve. This was calculated by multiplying the fit conductance–voltage and rectification factor curves together for each channel. Thedashed line corresponds to Vm= −35 mV, which is the threshold for spike initiation in a typical sympathetic neuron. D, Normalized steady-state conductance–voltage curve. This was measured by calculating the steady-state conductance–voltage curve and then normalizing to the tail current at −90 mV after complete activation of the current by a step to +40 mV. The tail current was extrapolated back tot = 0 to correct for deactivation. This procedure normalized for different levels of expression between different oocytes and different channels. Although this procedure did not give absolute values for the fractional conductance, it did allow direct comparison of the relative heights and shapes of the G–V curve for the three channels. Symbols have the same representations as inA and B. Data points are averages from six or eight cells; error bars are SEM.
Fig. 6.
Fig. 6.
Inactivation rates of the erg1,erg2, and erg3 channels.A, Current traces showing channel inactivation at 0, +20, and +40 mV. Membrane potential was depolarized to +40 mV for 1000 msec to activate the channels fully. For erg1 anderg2, a brief (15–20 msec) hyperpolarizing step to −95 mV was used to allow for recovery from inactivation before the depolarizing voltage step shown in the recordings. Forerg3, because the rate of deactivation was significantly faster than for the other two channels, a slightly modified protocol was used. The hyperpolarizing step was shorter (7 msec), and the step potential was more positive (−70 mV). With the use of this protocol minimal deactivation (<6%) occurred so that during the subsequent depolarization step the kinetics of inactivation were not significantly contaminated by reactivation. B, Comparison of the inactivation rates of the erg1, erg2, anderg3 channels. Inactivation rates were measured as the inverse of the time constant of a single exponential fit to the current traces. Data are averages from seven cells; error bars are SEM.
Fig. 8.
Fig. 8.
Inhibition of the erg1,erg2, and erg3 channels by the methanesulfonanilide E4031. A, Tail currents in the presence of increasing concentrations of E4031. The procedure used to measure the degree of blockade at each drug concentration was similar to that described previously (Snyders and Chaudhary, 1996). Because the drug is an open channel blocker with a very slow on-rate of binding, it was necessary to depolarize the cell repetitively to reach equilibrium binding. A 20 sec step to +20 mV was applied at 0.033 Hz until no further reduction in current was seen for that particular drug concentration. At that point a test step to +10 mV for 1 sec was applied, and the tail current at −60 mV was measured.B, Hill plots of E4031 inhibition of theerg1, erg2, and erg3 channels showing the KD for channel blockade. Data points were fit with the Hill equation: percentage of blockade = 1/(1 + (KD/[E4031])), whereKD = 99 ± 10, 116 ± 11, and 193 ± 18 nm for erg1,erg2, and erg3, respectively. Data points are averages from three or four cells; error bars are SEM.

References

    1. Barhanin J, Lesage F, Guillemare E, Fink M, Lazdunski M, Romey G. KVLQT1 and IsK (minK) proteins associate to form the IKs cardiac potassium current. Nature. 1996;384:78–80. - PubMed
    1. Brown DA. M currents. In: Narahashi T, editor. Ion channels. Plenum; New York: 1988. pp. 55–94. - PubMed
    1. Cassell JF, Clark AL, McLachlan EM. Characteristics of phasic and tonic sympathetic ganglion cells of the guinea-pig. J Physiol (Lond) 1986;372:457–483. - PMC - PubMed
    1. Chiesa N, Rosati B, Arcangeli A, Olivotto M, Wanke E. A novel role for HERG K+ channels: spike frequency adaptation. J Physiol (Lond) 1997;501:313–318. - PMC - PubMed
    1. Colman A. Translation of eukaryotic messenger RNA in Xenopus oocytes. In: Hames BD, Higgins SJ, editors. Transcription and translation. IRL; Oxford: 1984. pp. 271–302.

Publication types

MeSH terms