. 1997 Dec 9;94(25):13730-4.
doi: 10.1073/pnas.94.25.13730.

From tropics to tundra: global convergence in plant functioning

Affiliations

From tropics to tundra: global convergence in plant functioning

P B Reich et al. Proc Natl Acad Sci U S A. .

Abstract

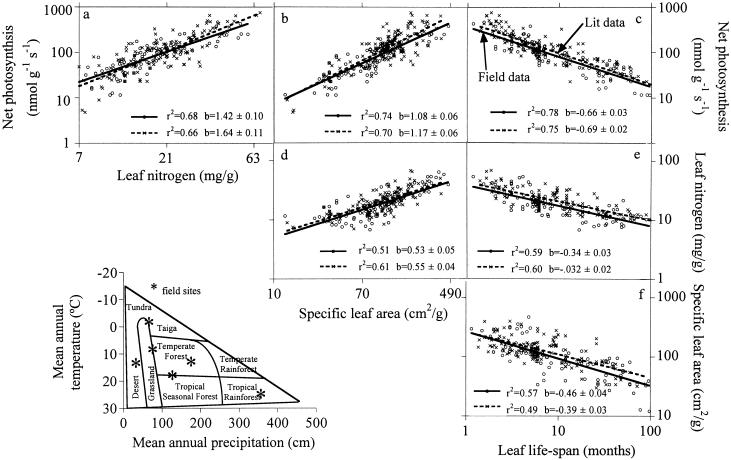
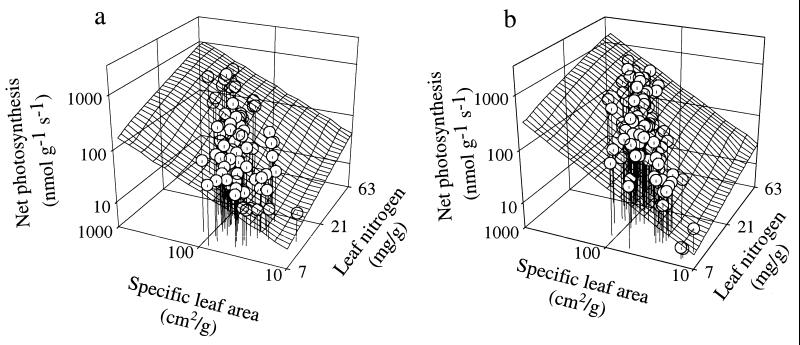
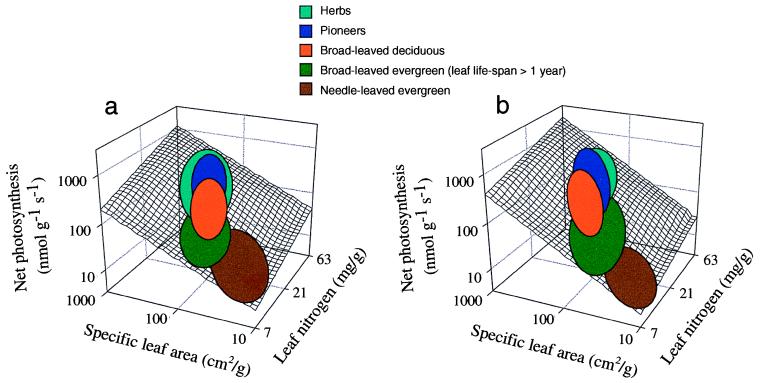
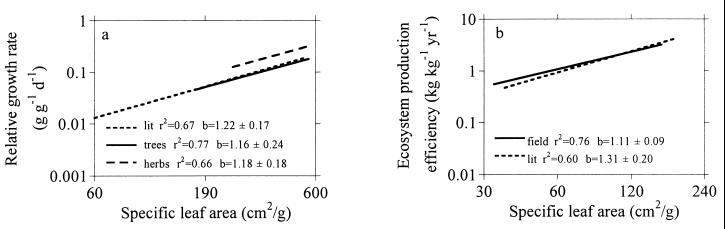
Despite striking differences in climate, soils, and evolutionary history among diverse biomes ranging from tropical and temperate forests to alpine tundra and desert, we found similar interspecific relationships among leaf structure and function and plant growth in all biomes. Our results thus demonstrate convergent evolution and global generality in plant functioning, despite the enormous diversity of plant species and biomes. For 280 plant species from two global data sets, we found that potential carbon gain (photosynthesis) and carbon loss (respiration) increase in similar proportion with decreasing leaf life-span, increasing leaf nitrogen concentration, and increasing leaf surface area-to-mass ratio. Productivity of individual plants and of leaves in vegetation canopies also changes in constant proportion to leaf life-span and surface area-to-mass ratio. These global plant functional relationships have significant implications for global scale modeling of vegetation-atmosphere CO2 exchange.


Figures

Figure 1
Figure 1
(af) Relations (of the form Y = aXb) among mass-based photosynthetic capacity, SLA, and leaf nitrogen concentration of young mature leaves and their expected life-span, fitted by type I regression (of log y = a + b∗log X) for species in two data sets (—o—, our field data for 111 species from six biomes; —x—, the global literature data set). The coefficients of determination (r2) and the power function (scaling) exponents (b ± 1 SE) are shown in each panel (all P < 0.001). (Inset) Diagram of global biome distribution in relation to annual temperature and precipitation (12) and location of our six field sites on that matrix.
Figure 2
Figure 2
(a and b) Relations (all variables were log10-based) between Amax vs. leaf N and SLA using multiple regression of Amax as a function of leaf N (P < 0.001) and SLA (P < 0.001). (a) Field data from six biomes: log10 (Amax) = −0.46 + 0.77∗log10 (N) + 0.71∗log10 (SLA); r2 = 0.85, n = 104, P < 0.001. (b) Literature data: log10 (Amax) = −0.76 + 0.88∗log10 (N) + 0.82∗log10 (SLA); r2 = 0.8, n = 109, P < 0.001.
Figure 3
Figure 3
(a and b) Location of major plant functional groups (crossing biomes) on the three-dimensional leaf trait response surface for field data (a) and literature data (b). Major groups considered were: herbs (herbaceous species in all tundra, grassland, and forested ecosystems), pioneers (pioneer trees in boreal, temperate, and tropical forests), broad-leaved deciduous (mostly mid- to late successional temperate and tropical woody species that are deciduous; plus tropical broad-leaved evergreen tree species with leaf life-span <11 months), broad-leaved evergreen (woody broad-leaved species with leaf life-span >1 year, usually common to resource-poor environments), and needle-leaved evergreen (includes all evergreen coniferous species).
Figure 4
Figure 4
(A) Relations (all P < 0.001) between relative growth rate of young plants and their SLA fitted by type I regression (of log Y = a + b∗log X) for species in three data sets [a literature data set of 26 woody and herbaceous species, a 24-species herbaceous data set (14), and a 9-tree species data set (19)]. log10 (Y) = 1.05 + 1.22∗log10 (SLA), r2 = 0.67, log10 (Y) = −0.73 + 1.18∗log10 (SLA), r2 = 0.66, and log10 (Y) = −0.92 + 1.16∗log10 (SLA), r2 = 0.77, respectively, for the three data sets. (B) Relations (P < 0.0001) between ecosystem production efficiency (annual aboveground net primary production/live canopy foliage dry mass) and mean canopy SLA fitted by regression (of log Y = a + b∗log X) for species in two data sets [a literature data set of 32 forest stands from a broad region (22) and a separate 48-forest stand data set from central North America (40)]. log10 (Y) = 2.33 + 1.31∗log10 (SLA), r2 = 0.60, n = 32; log10 (Y) = −1.95 + 1.11∗log10 (SLA), r2 = 0.76, n = 48, respectively.

Comment in

  • On the utility of nitrogen in leaves.
    Loomis RS. Loomis RS. Proc Natl Acad Sci U S A. 1997 Dec 9;94(25):13378-9. doi: 10.1073/pnas.94.25.13378. Proc Natl Acad Sci U S A. 1997. PMID: 9391029 Free PMC article. No abstract available.

References

    1. Grime J P, Hunt R. J Ecol. 1975;63:393–422.
    1. Chapin F S., III Annu Rev Ecol Syst. 1980;11:233–260.
    1. Schulze E-D, Kelliher F M, Körner C, Lloyd J, Leuning R. Annu Rev Ecol Syst. 1994;25:629–660.
    1. Field C, Mooney H A. In: On the Economy of Plant Form and Function. Givnish T, editor. Cambridge, U.K.: Cambridge Univ. Press; 1986. pp. 25–55.
    1. Reich P B, Walters M B, Ellsworth D S. Ecol Monogr. 1992;62:365–392.

LinkOut - more resources