Comparative Study
. 1997 Dec 9;94(25):13798-803.
doi: 10.1073/pnas.94.25.13798.

Mitochondrial mutational spectra in human cells and tissues

Affiliations
Comparative Study

Mitochondrial mutational spectra in human cells and tissues

K Khrapko et al. Proc Natl Acad Sci U S A. .

Abstract

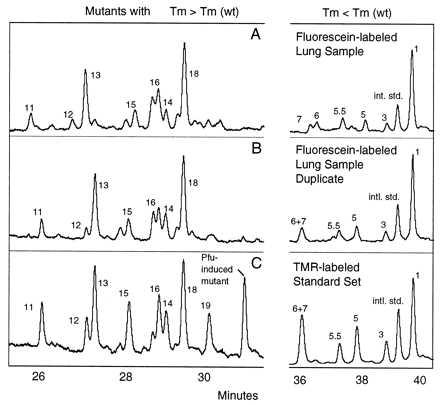
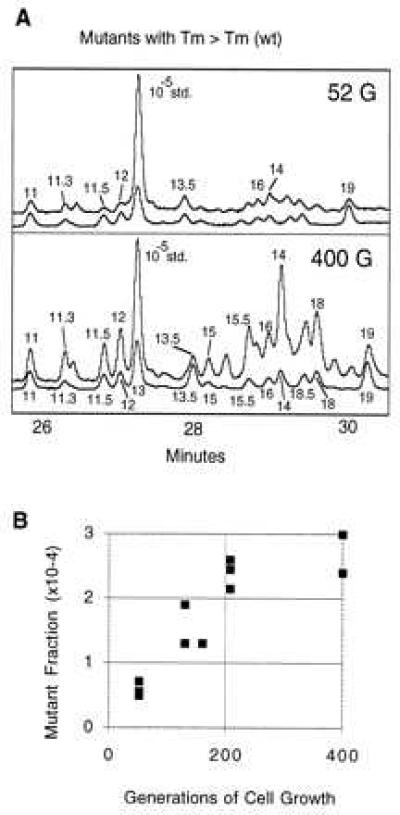
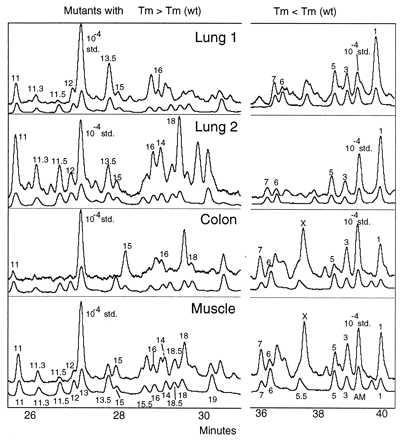
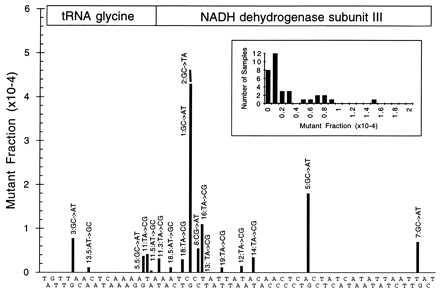
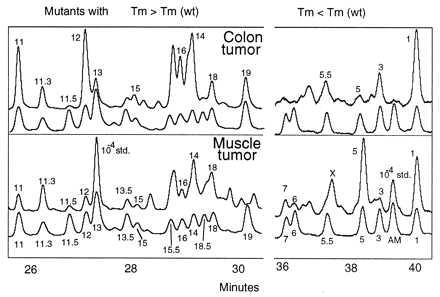
We have found that human organs such as colon, lung, and muscle, as well as their derived tumors, share nearly all mitochondrial hotspot point mutations. Seventeen hotspots, primarily G --> A and A --> G transitions, have been identified in the mitochondrial sequence of base pairs 10,030-10,130. Mutant fractions increase with the number of cell generations in a human B cell line, TK6, indicating that they are heritable changes. The mitochondrial point mutation rate appears to be more than two orders of magnitude higher than the nuclear point mutation rate in TK6 cells and in human tissues. The similarity of the hotspot sets in vivo and in vitro leads us to conclude that human mitochondrial point mutations in the sequence studied are primarily spontaneous in origin and arise either from DNA replication error or reactions of DNA with endogenous metabolites. The predominance of transition mutations and the high number of hotspots in this short sequence resembles spectra produced by DNA polymerases in vitro.


Figures

Figure 1
Figure 1
Reproducibility of the procedure and identification of mutants. Restriction-digested DNA containing the equivalent of ≈3 × 10⁸ copies of the mitochondrial target sequence was divided into two samples, and each was doped at 10−4 with two internal standards. A higher melting temperature mutant originally isolated from human tissue, mutant 13 (T → C, base pair 10,072), and a constructed mutant with a lower melting temperature than wild type (G → A, base pair 10,040) were used as internal standards. The samples were subjected to the mutational spectrometry procedure as described in Materials and Methods. (A and B) The results of CDCE separations of mutant homoduplexes isolated from duplicate DNA samples. The x axis reflects the time since the beginning of the run at which the peak reaches the detector and the y axis marks the relative intensity of fluorescence. (Left) Mutants with melting temperatures higher than wild type. (Right) Mutants with melting temperatures lower than wild type. The fluorescein-labeled samples were separated at the same time and in the same capillary as the tetramethylrhodamine (TMR)-labeled standard set containing all previously identified peaks. (C) TMR-labeled standard set separated simultaneously with the sample in B. Peaks in the samples were identified based on comigration with TMR-labeled standards and are numbered accordingly.
Figure 5
Figure 5
Mutational spectra of cultured human cells. (A) TK6 cells grown for 52 and 400 generations were sampled. DNA was isolated from an aliquot of cells and subjected to mutational spectrometry. CDCE runs of the mutational spectra observed are shown. The axes are as in Fig. 1. Only the mutants with melting temperatures higher than wild type are shown. (B) Increase in mutant fraction of mutant 1 (G → A, base pair 10,068) with generations of human cells grown in culture. TK6 cells were grown in spinner cultures and sampled at the number of generations designated on the horizontal axis. Mutant fraction is plotted on the y axis. Individual points represent separate mutant fraction determinations from independent cell aliquots taken from a single culture.
Figure 2
Figure 2
Mutational spectra of lung, colon, and muscle samples. DNA was isolated from ≈1 g of epithelial cells from a human colon, 1 g of human muscle tissue, and two samples of 106 human bronchial epithelial cells each. DNA was restriction digested and mixed with internal standards, and the mutational spectra were determined. Depicted are separations of fluorescein-labeled samples along with the coseparated tetramethylrhodamine-labeled authentic standards (lower of each pair of curves) for samples of two lungs, colon, and muscle. The x and y axes and labels are as in Fig. 1. “X” marks a peak that has not yet been sequenced.
Figure 3
Figure 3
Position, type of mutation, and frequency of hotspot mutations. The type of mutation and its position for each of the mutants sequenced so far are shown. The target sequence is printed along the x axis to provide information on sequence context (the sequence is staggered for clarity). The target sequence starts with T(10,031) and ends with T(10,129). The positions of the two genes encoded by this sequence, tRNAgly and NADH dehydrogenase subunit III, are designated. The height of each peak reflects the average mutant fraction of this peak in most of the lung samples analyzed to date. Note that mutants 1 and 2 are different substitutions at the same base pair. Also note that mutant 13 (T → C, base pair 10,072) was used as an internal standard to measure the size of other peaks. We estimate the average mutant fraction for mutant 13 in tissues to be 2 × 10⁻⁵ based on four samples. Error bars are not shown in this figure because the data are not normally distributed (see Discussion). Instead, the Insert demonstrates the distribution of mutant fractions among bronchial epithelial samples for a representative mutant, p11.3.
Figure 4
Figure 4
Mutational spectra of colon and muscle tumor samples. The mutational spectra were determined for colon and muscle tumor samples of 1 g and 20 mg, respectively. Shown are the CDCE separations of the mutational spectra for colon and muscle tumor samples as well as the coseparations of the tetramethylrhodamine-labeled set (lower curve of each pair of curves). The axes and labels are as in Fig. 1.

References

    1. Benzer S, Freese E. Proc Natl Acad Sci USA. 1958;44:112–119. - PMC - PubMed
    1. Thilly W G. Annu Rev Pharmacol Toxicol. 1990;30:369–385. - PubMed
    1. Armstrong J D, Kunz B A. Proc Natl Acad Sci USA. 1990;87:9005–9009. - PMC - PubMed
    1. Roy A, Fuchs R P. Mol Gen Genet. 1994;245:69–77. - PubMed
    1. Oller A R, Thilly W G. J Mol Biol. 1992;228:813–826. - PubMed

Publication types

Substances

LinkOut - more resources