Case Reports
. 1997 Dec 9;94(25):14190-4.
doi: 10.1073/pnas.94.25.14190.

Is blindsight like normal, near-threshold vision?

Affiliations
Case Reports

Is blindsight like normal, near-threshold vision?

P Azzopardi et al. Proc Natl Acad Sci U S A. .

Abstract

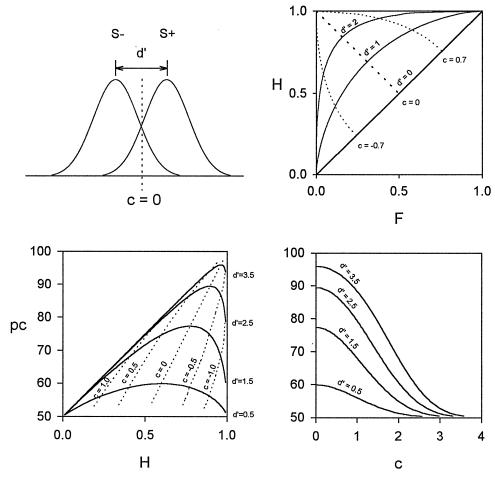
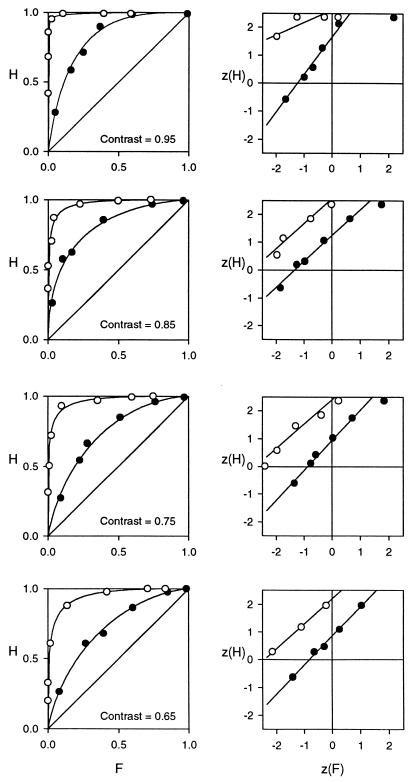
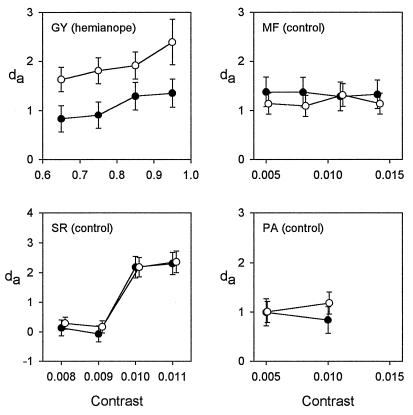
Blindsight is the rare and paradoxical ability of some human subjects with occipital lobe brain damage to discriminate unseen stimuli in their clinically blind field defects when forced-choice procedures are used, implying that lesions of striate cortex produce a sharp dissociation between visual performance and visual awareness. Skeptics have argued that this is no different from the behavior of normal subjects at the lower limits of conscious vision, at which such dissociations could arise trivially by using different response criteria during clinical and forced-choice tests. We tested this claim explicitly by measuring the sensitivity of a hemianopic patient independently of his response criterion in yes-no and forced-choice detection tasks with the same stimulus and found that, unlike normal controls, his sensitivity was significantly higher during the forced-choice task. Thus, the dissociation by which blindsight is defined is not simply due to a difference in the patients' response bias between the two paradigms. This result implies that blindsight is unlike normal, near-threshold vision and that information about the stimulus is processed in blindsighted patients in an unusual way.


Figures

Figure 1
Figure 1
Signal detection. (Top left) Two standard normal distributions represent a subject’s internal (neural) signals associated with absence of a stimulus (S−, left) and presence of a stimulus (S+, right). The subject must chose a criterion above which he should respond “S+” and below which he should respond “S− .” As the distributions overlap, judgements based on any criterion will result in some misidentifications, yielding some errors (false alarms and misses) as well as correct responses (hits and correct rejections). The subject’s sensitivity, d′, in units of SD, is given by d′ = z(H) − z(F) where hit rate, H, = number of hits/(number of hits + misses) and false alarm rate, F, = number of false alarms/(number of false alarms + correct rejections) and z is the inverse of the normal distribution function. When the subject cannot discriminate at all, H = F and d′ = 0. The subject’s criterion, c, is given by c = −0.5 [z(H) + z(F)] and is equal to 0 when false alarm and miss (M) rates are equal, negative when F > M, and positive when F < M. Thus, c is a measure of response bias, the tendency of the subject to say S+ irrespective of the actual number of S+s presented. (Top right) The relation between sensitivity and response bias, or ROC, represented as plots of hit rate vs. false alarm rate. Curves deviating from the major diagonal represent lines of isosensitivity, which describe the relation between hit and false alarm rates as bias changes at constant sensitivity. Curves deviating from the minor diagonal represent lines of isobias across the range of sensitivities. (Bottom) Variation of percentage correct with hit rate (left) and response criterion (right) at various fixed sensitivities calculated from SDT given that S+ and S− have equal probabilities of presentation. The latter graph is symmetric about the c = 0 line. The graphs show how the performance of a subject with constant sensitivity could vary between 50 and 95% correct depending on the subject’s response criterion.
Figure 2
Figure 2
ROCs fitted to ratings assigned by the hemianopic subject to stimuli of various contrasts presented in his scotoma during yn (black circles) and 2afc (white circles) detection tasks.
Figure 3
Figure 3
Sensitivity as a function of stimulus contrast for yn (black circles) and 2afc (white circles) detection tasks in the hemianopic subject and three control subjects. Data were plotted only if ROCs could be fitted adequately to responses at the P < 0.01 level. Error bars indicate 95% confidence limits. Note the different contrast scale for G.Y. and the control subjects.

Similar articles

Cited by

References

    1. Holmes G. Proc R Soc Lond B. 1945;132:348–361.
    1. Pöppel E, Held R, Frost D. Nature (London) 1973;243:295–296. - PubMed
    1. Weiskrantz L, Warrington E K, Sanders M D, Marshall J. Brain. 1974;97:709–728. - PubMed
    1. Weiskrantz L. Blindsight: A Case Study and Its Implications. Oxford: Oxford Univ. Press; 1986.
    1. Mohler C W, Wurtz R H. J Neurophsyiol. 1977;40:74–94. - PubMed

Publication types

LinkOut - more resources