

Kinetic characterization of brush border myosin-I ATPase
- PMID: 9405612
- PMCID: PMC24965
- DOI: 10.1073/pnas.94.26.14332
Kinetic characterization of brush border myosin-I ATPase
Abstract
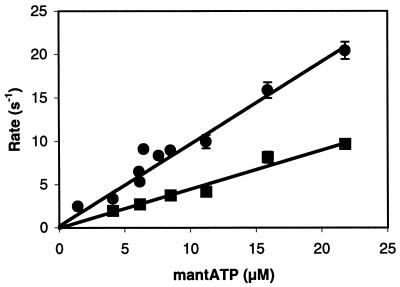
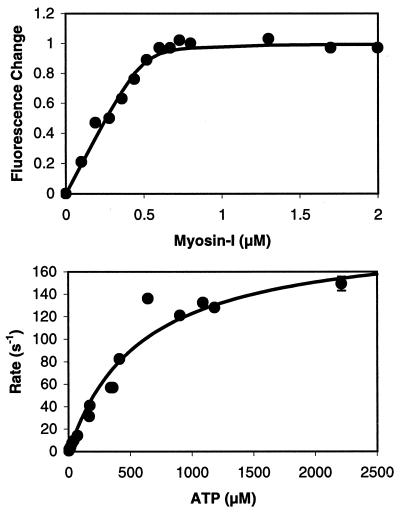
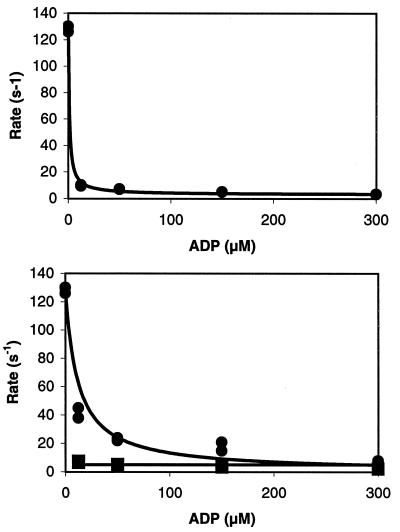
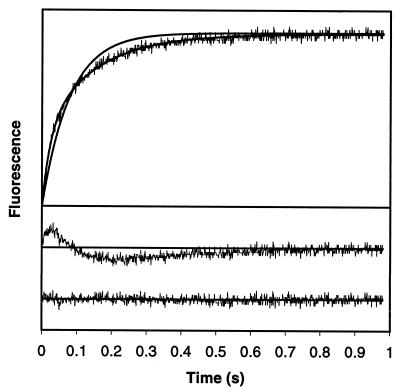
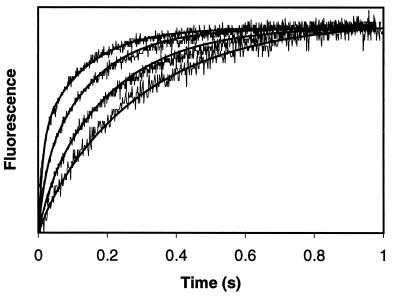
Brush border myosin-I (BBM-I) is a single-headed unconventional myosin found in the microvilli of intestinal epithelial cells. We used stopped-flow kinetic analysis to measure the rate and equilibrium constants for several steps in the BBM-I ATPase cycle. We determined the rates for ATP binding to BBM-I and brush border actomyosin-I (actoBBM-I), the rate of actoBBM-I dissociation by ATP, and the rates for the steps in ADP dissociation from actoBBM-I. The rate and equilibrium constants for several of the steps in the actoBBM-I ATPase are significantly different from those of other members of the myosin superfamily. Most notably, dissociation of the actoBBM-I complex by ATP and release of ADP from actoBBM-I are both very slow. The slow rates of these steps may play a role in lengthening the time spent in force-generating states and in limiting the maximal rate of BBM-I motility. In addition, release of ADP from the actoBBM-I complex occurs in at least two steps. This study provides evidence for a member of the myosin superfamily with markedly divergent kinetic behavior.
Figures
Similar articles
-
Biochemical kinetic characterization of the Acanthamoeba myosin-I ATPase.J Cell Biol. 1996 Mar;132(6):1053-60. doi: 10.1083/jcb.132.6.1053. J Cell Biol. 1996. PMID: 8601584 Free PMC article.
-
Vertebrate myosin VIIb is a high duty ratio motor adapted for generating and maintaining tension.J Biol Chem. 2005 Nov 25;280(47):39665-76. doi: 10.1074/jbc.M507667200. Epub 2005 Sep 26. J Biol Chem. 2005. PMID: 16186105
-
Kinetic and equilibrium analysis of the myosin ATPase.Methods Enzymol. 2009;455:157-92. doi: 10.1016/S0076-6879(08)04206-7. Methods Enzymol. 2009. PMID: 19289206 Free PMC article.
-
The chemical mechanism of myosin-I: implications for actin-based motility and the evolution of the myosin family of motor proteins.Cell Struct Funct. 1996 Oct;21(5):351-6. doi: 10.1247/csf.21.351. Cell Struct Funct. 1996. PMID: 9118240 Review.
-
The actomyosin ATPase: a two-state system.Philos Trans R Soc Lond B Biol Sci. 1992 Apr 29;336(1276):63-70; discussion 70-1. doi: 10.1098/rstb.1992.0045. Philos Trans R Soc Lond B Biol Sci. 1992. PMID: 1351298 Review.
Cited by
-
High-resolution cryo-EM structures of actin-bound myosin states reveal the mechanism of myosin force sensing.Proc Natl Acad Sci U S A. 2018 Feb 6;115(6):1292-1297. doi: 10.1073/pnas.1718316115. Epub 2018 Jan 22. Proc Natl Acad Sci U S A. 2018. PMID: 29358376 Free PMC article.
-
Temperature dependence of nucleotide association and kinetic characterization of myo1b.Biochemistry. 2006 Sep 26;45(38):11589-97. doi: 10.1021/bi0611917. Biochemistry. 2006. PMID: 16981718 Free PMC article.
-
Motor and tail homology 1 (Th1) domains antagonistically control myosin-1 dynamics.Biophys J. 2014 Feb 4;106(3):649-58. doi: 10.1016/j.bpj.2013.12.038. Biophys J. 2014. PMID: 24507605 Free PMC article.
-
The kinetic mechanism of myosin V.Proc Natl Acad Sci U S A. 1999 Nov 23;96(24):13726-31. doi: 10.1073/pnas.96.24.13726. Proc Natl Acad Sci U S A. 1999. PMID: 10570140 Free PMC article.
-
Pathophysiology of human hearing loss associated with variants in myosins.Front Physiol. 2024 Mar 18;15:1374901. doi: 10.3389/fphys.2024.1374901. eCollection 2024. Front Physiol. 2024. PMID: 38562617 Free PMC article. Review.
References
Publication types
MeSH terms
Substances
Grants and funding
LinkOut - more resources
Full Text Sources
