. 1997 Dec 23;94(26):14389-93.
doi: 10.1073/pnas.94.26.14389.

RGS2/G0S8 is a selective inhibitor of Gqalpha function

Affiliations

RGS2/G0S8 is a selective inhibitor of Gqalpha function

S P Heximer et al. Proc Natl Acad Sci U S A. .

Abstract

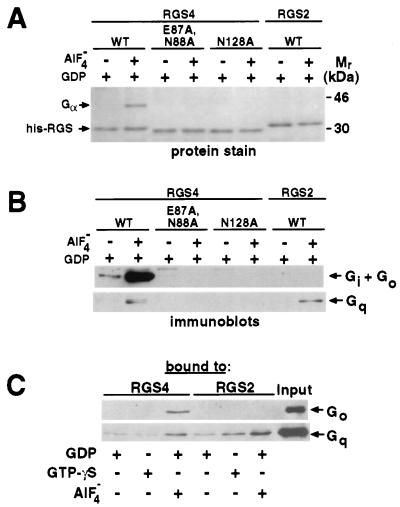
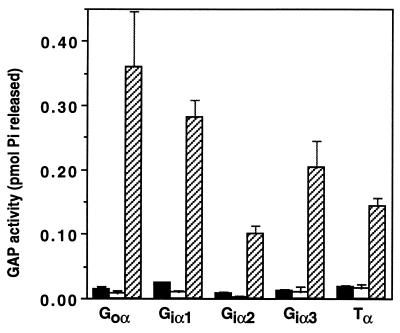
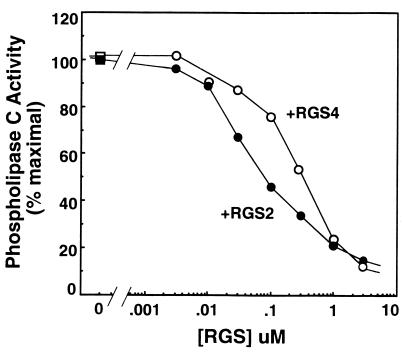
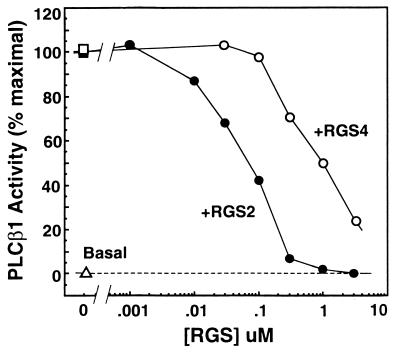
RGS (regulators of G protein signaling) proteins are GTPase activating proteins that inhibit signaling by heterotrimeric G proteins. All RGS proteins studied to date act on members of the Gialpha family, but not Gsalpha or G12alpha. RGS4 regulates Gialpha family members and Gqalpha. RGS2 (G0S8) is exceptional because the G proteins it regulates have not been identified. We report that RGS2 is a selective and potent inhibitor of Gqalpha function. RGS2 selectively binds Gqalpha, but not other Galpha proteins (Gi, Go, Gs, G12/13) in brain membranes; RGS4 binds Gqalpha and Gialpha family members. RGS2 binds purified recombinant Gqalpha, but not Goalpha, whereas RGS4 binds either. RGS2 does not stimulate the GTPase activities of Gsalpha or Gialpha family members, even at a protein concentration 3000-fold higher than is sufficient to observe effects of RGS4 on Gialpha family members. In contrast, RGS2 and RGS4 completely inhibit Gq-directed activation of phospholipase C in cell membranes. When reconstituted with phospholipid vesicles, RGS2 is 10-fold more potent than RGS4 in blocking Gqalpha-directed activation of phospholipase Cbeta1. These results identify a clear physiological role for RGS2, and describe the first example of an RGS protein that is a selective inhibitor of Gqalpha function.


Figures

Figure 1
Figure 1
Binding of RGS proteins and Gα subunits. Panels A and B show the binding of RGS2 and RGS4 to G protein α subunits in membrane fractions. The indicated wild-type or mutant forms of histidine-tagged RGS4 or wild-type histidine-tagged RGS2 were incubated with bovine brain membranes treated with GDP or GDP and AlF4. Complexes containing RGS proteins were purified from detergent extracts by using Ni2+-NTA chromatography. (A) Polypeptides bound to RGS proteins were resolved by SDS/PAGE, transferred to nitrocellulose blots and detected by staining with Ponceau S. The position where α subunits of the Gi family migrate is indicated. Mutant forms of RGS4 are smaller because they lack the first 12 amino acids of the protein, which is dispensable for GAP activity. (B) Identification of Gα subunits bound by RGS proteins. Nitrocellulose blots as in A were probed with antisera specific for the indicated G protein α subunits (and G12/13 and Gsα; data not shown) and horseradish peroxidase-coupled secondary antibodies. Enhanced chemiluminescence (Amersham) detection was used. (C) Interaction of RGS proteins with purified G protein α subunits in their inactive (GDP), active (GTPγS) and transition state (GDP + AlF4) conformations. Binding of the indicated G protein α subunits and histidine-tagged RGS proteins was detected by isolating RGS-G protein complexes on Ni2+-NTA beads and subjecting the eluted proteins to Western blot analysis. In experiments using Goα, 10% and 30%, respectively, of the input and eluted samples were analyzed. In those using Gqα, 10% of the input and eluted samples were analyzed.
Figure 2
Figure 2
Comparison of GAP activities of RGS2 and RGS4 toward various Gα subunits. The indicated G protein α subunits (100 nM final concentration) loaded with [γ-32P]GTP were incubated 10 s with a buffer control (black bars), histidine-tagged RGS2 (100 nM final concentration; open bars) or histidine-tagged RGS4 (100 nM final concentration; hatched bars). The amount of 32Pi released was determined by liquid scintillation spectrometry, as described in Experimental Procedures. The results shown are the average of two assays; SDs are indicated.
Figure 3
Figure 3
Effects of RGS2 and RGS4 on GTPγS-activated synthesis of inositol 1,4,5-trisphosphate (InsP3) by NG-108 cell membranes. NG-108 cell membranes (6.5 μg) were incubated as described in Experimental Procedures for 30 min at 30°C with 100 μM GTPγS (□, ▪) or GTPγS and various concentrations of RGS2 (•) or RGS4 (○). Synthesis of [3H]InsP3 was measured and [3H]InsP3 accumulation in the absence of NG-108 membranes (blank = 118 pmol) was subtracted from each value. Values are expressed as a percentage of total [3H]InsP3 accumulated over 30 min at 30°C in the presence of GTPγS and absence of RGS proteins (100% = 387 pmol/assay and 424 pmol/assay for RGS4 and RGS2, respectively; basal unstimulated PLC activity was 78 pmol/assay). The data presented are the average of duplicate values and are representative of two independent experiments, each with similar results.
Figure 4
Figure 4
Inhibition of Gqα-mediated PLC activation by RGS2 and RGS4. The effects of RGS2 or RGS4 on the activation of purified PLCβ1 by activated (GTPγS-bound) Gqα. Purified recombinant Gqα was incubated with 1 mM GTPγS for 1 hr at 30°C. Activated Gqα (1 nM final concentration) was mixed with purified recombinant PLCβ1 (1 ng) and [3H]phosphatidyl inositol 4,5-bisphosphate-containing phospholipid vesicles in the absence (□, ▪) or presence of various concentrations of RGS2 (•) or RGS4 (○). Synthesis of [3H]InsP3 was measured and basal unstimulated PLCβ1 activity (170 pmol⋅min⋅ng PLC, ▵) was subtracted from each value. Blank values, i.e., [3H]InsP3 accumulation in the absence of PLCβ1 were 155 pmol/min per assay. Values are expressed as a percentage of the total [3H]InsP3 accumulated over 20 min at 30°C in the presence of GTPγS-activated Gqα and the absence of RGS proteins (100% = 716 pmol/min/ng PLC and 571 pmol/min/ng PLC for the experiments involving RGS4 and RGS2, respectively). The data presented are averages of duplicate values and representative of three independent experiments, each with similar results.

Similar articles

Cited by

References

    1. Hepler J R, Gilman A G. Trends Biochem Sci. 1992;17:383–387. - PubMed
    1. Bourne H R, Sanders D A, McCormick F. Nature (London) 1990;348:125–132. - PubMed
    1. Koelle M R. Curr Opin Cell Biol. 1997;9:143–147. - PubMed
    1. Dohlman H G, Song J, Ma D, Courchesne W E, Thorner J. Mol Cell Biol. 1996;16:5194–5209. - PMC - PubMed
    1. Koelle M R, Horvitz H R. Cell. 1996;84:115–125. - PubMed

Publication types

LinkOut - more resources