. 1997 Dec 23;94(26):14423-8.
doi: 10.1073/pnas.94.26.14423.

Flickering fusion pores comparable with initial exocytotic pores occur in protein-free phospholipid bilayers

Affiliations

Flickering fusion pores comparable with initial exocytotic pores occur in protein-free phospholipid bilayers

A Chanturiya et al. Proc Natl Acad Sci U S A. .

Abstract

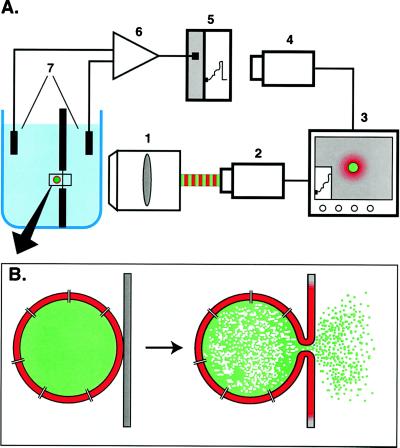
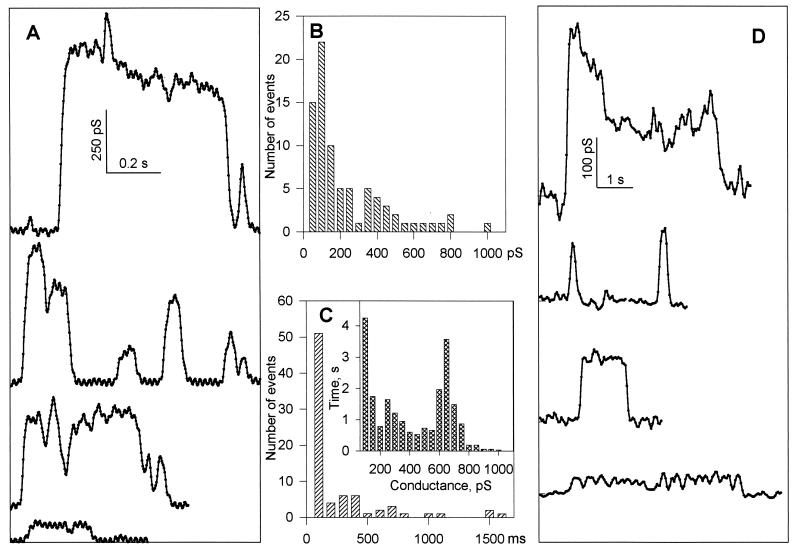
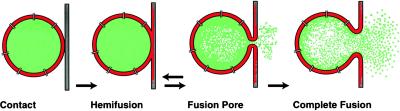
For the act of membrane fusion, there are two competing, mutually exclusive molecular models that differ in the structure of the initial pore, the pathway for ionic continuity between formerly separated volumes. Because biological "fusion pores" can be as small as ionic channels or gap junctions, one model posits a proteinaceous initial fusion pore. Because biological fusion pore conductance varies widely, another model proposes a lipidic initial pore. We have found pore opening and flickering during the fusion of protein-free phospholipid vesicles with planar phospholipid bilayers. Fusion pore formation appears to follow the coalescence of contacting monolayers to create a zone of hemifusion where continuity between the two adherent membranes is lipidic, but not aqueous. Hypotonic stress, causing tension in the vesicle membrane, promotes complete fusion. Pores closed soon after opening (flickering), and the distribution of fusion pore conductance appears similar to the distribution of initial fusion pores in biological fusion. Because small flickering pores can form in the absence of protein, the existence of small pores in biological fusion cannot be an argument in support of models based on proteinaceous pores. Rather, these results support the model of a lipidic fusion pore developing within a hemifused contact site.


Figures

Figure 1
Figure 1
Experimental system. (A) The chamber, similar to that described (14, 17), was placed in front of the long working distance objective (1) (Nikon, ×40, 0.5 numerical aperture). A custom-made dual-wavelength fluorescent imaging system was used to alternate the recording of the fluorescence of two dyes (42). The fluorescent image was projected onto an intensified video camera (2). Another camera (4) was focused on a chart recording (5) of transmembrane current, and this image was merged with the microscope image, providing the reference for synchronization (3) of fluorescence and electrical data, recorded on an optical disk recorder (not shown). A conventional voltage clamp amplifier (6) converted transmembrane current measured across Ag/AgCl electrodes (7), and current was also recorded on a modified digital–analog tape recorder (not shown). Individual lipid vesicles were placed on the planar membrane by using a glass micropipette (not shown) filled with a liposome suspension. (B) Schematic diagram of the fusion of a vesicle to a planar membrane. Fusion can be detected as membrane dye spread, release of water-soluble dye, a conductance increase because of channel incorporation, or as the increase in capacitance proportional to the increase in membrane area.
Figure 2
Figure 2
Hemifusion and fusion pore formation in fusion of individual liposomes with the planar membrane. Fluorescent images were obtained with membrane dye rhodamine phosphatidylethanolamine (red) and aqueous dye calcein (green) filter sets. Scale bars in all panels are 10 μm for images, and 30 pS and 10 s for electrical recordings. Blue lines show the frame position on a time scale represented by the recording of transmembrane current. Throughout, transmembrane voltage was +30 mV with respect to the trans chamber. All records begin from the moment of vesicle placement onto the cis side of the planar membrane. (A) Hemifusion of a liposome in osmotic balance with external medium. Membrane dye (red) spread to the planar membrane radially from the liposome (panel 3) and then dispersed throughout the planar film. This demonstrates hemifusion of the vesicle with the planar membrane. The inner leaflet of the liposome would not mix in hemifusion: correspondingly, liposome membrane dye fluorescence remains bright despite the flash of membrane dye in panels 3–5. Neither calcein fluorescence nor membrane conductance changed during hemifusion. (B) Transient fusion pores in an osmotically balanced liposome observed after hemifusion of the liposome with the planar membrane. Hemifusion was detected as in A approximately 10 s before panel 2. A significant decrease in content calcein fluorescence (compare green panels 2–3 and 4–5) correlates with spikes of transmembrane current (fusion pore flickering). A second rhodamine flash (panel 6), more intensive then the first, presumably corresponds to an expansion of the zone of hemifusion. More content release is seen with continued fusion pore flickering. As in A, membrane dye is still visible in the liposome (panel 7) after the diffusion of released membrane dye over the planar membrane, more evidence for hemifusion. In control experiments neither liposomes without nystatin nor nystatin added without liposomes produced similar spikes. (C) Fusion of an osmotically stressed liposome with the planar membrane. (1–2) Hemifusion, seen as a rhodamine lipid dye flash (red) with no loss of calcein (green); (3–4) spikes of transmembrane current (transient fusion pore formation) with loss of liposome content calcein (green), continuing up through (5–6) expansion of hemifusion diaphragm. Finally the vesicle undergoes complete fusion, resulting in a large, off-scale increase in the conductance of planar bilayer (greater than 200 pS). This conductance then rapidly decreases toward baseline as a result of dilution and disassembling of nystatin–sterol channel complexes in the fused membranes. (7) At this stage inner and outer leaflet lipid dye (red) and internal content (green) have completely redistributed.
Figure 3
Figure 3
Conductance characteristics of fusion pores in phospholipid membranes. (A) Time-resolved fusion pore conductance in experiments with nystatin-permeabilized liposomes. Four independent short segments of membrane current, digitized at 400 Hz on a computer, are presented (after 10 points averaging and decimation to reduce noise) as typical examples of fusion pores. Conductance was estimated for the fusion pore in series with a 4.7-nS liposome (average liposome conductance). (B) Frequency histogram of maximum pore conductances. As in A, conductance was estimated for the fusion pore in series with a 4.7-nS liposome. (C) Histogram of pore lifetimes. Pore lifetimes were determined by analysis of the 10-point averaged and decimated data, by picking the first and last point of transients continuously above the noise of the baseline for greater than 100 ms. (Inset) Integrated histogram of pore conductance (see ref. 5). The time axis is defined as the time that a pore spends in a state within a given conductance interval, combining all fusion pores detected above noise (50 pS). (AC) Nystatin-containing liposomes. (D) Time-resolved fusion pore conductance calculated from admittance measurements in nystatin-containing liposomes.
Figure 4
Figure 4
Schematic diagram of sequential steps in phospholipid membrane fusion. As a first step the outer monolayer of a phospholipid vesicle coalesces with the contacting monolayer of the planar phospholipid bilayer membrane forming a trilaminar structure (hemifusion). A small fusion pore is formed in this area. Once formed, the fusion pore can close again or expand to some critical size when further expansion becomes irreversible.

References

    1. Tse F W, Iwata A, Almers W J. Cell Biol. 1993;121:543–552. - PMC - PubMed
    1. Zimmerberg J, Blumenthal R, Curran M, Sarkar D, Morris S. J Cell Biol. 1994;127:1885–1894. - PMC - PubMed
    1. Spruce A E, Breckenridge L J, Lee A K, Almers W. Neuron. 1990;4:643–654. - PubMed
    1. Nanavati C, Markin V S, Oberhauser A F, Fernandez J M. Biophys J. 1992;63:1118–1132. - PMC - PubMed
    1. Curran M J, Cohen F S, Chandler D E, Munson P J, Zimmerberg J. J Membr Biol. 1993;133:61–75. - PubMed

LinkOut - more resources