. 1997 Dec 23;94(26):14530-5.
doi: 10.1073/pnas.94.26.14530.

Benthic-pelagic links and rocky intertidal communities: bottom-up effects on top-down control?

Affiliations

Benthic-pelagic links and rocky intertidal communities: bottom-up effects on top-down control?

B A Menge et al. Proc Natl Acad Sci U S A. .

Abstract

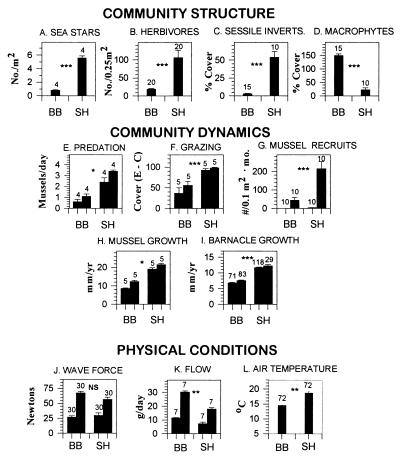
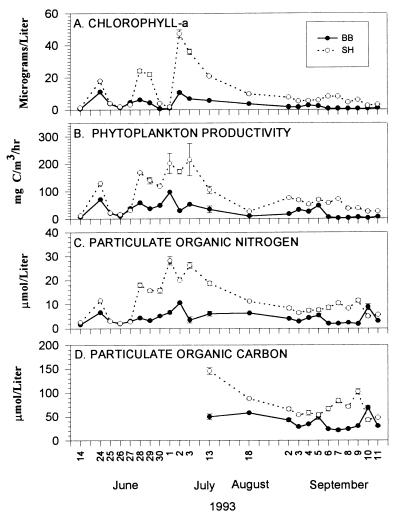
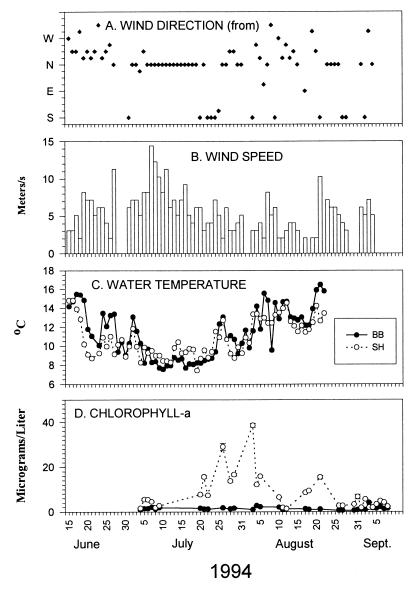
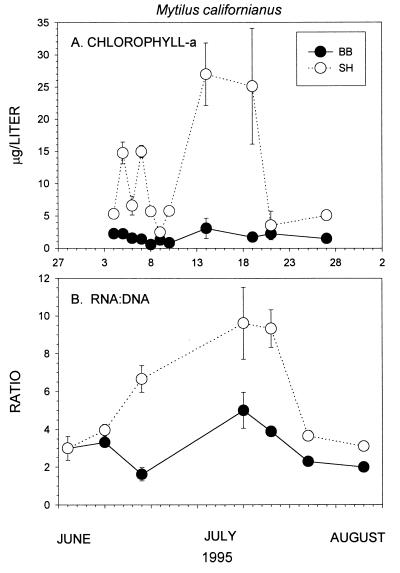
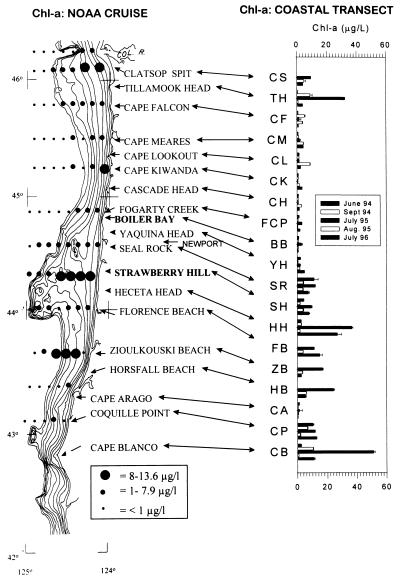
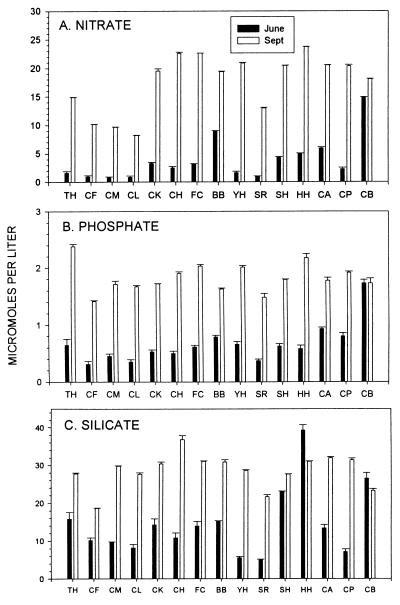
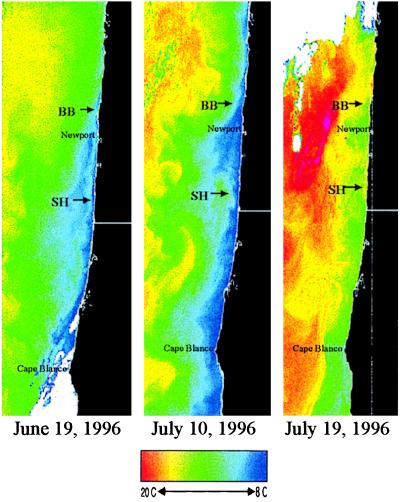
Insight into the dependence of benthic communities on biological and physical processes in nearshore pelagic environments, long considered a "black box," has eluded ecologists. In rocky intertidal communities at Oregon coastal sites 80 km apart, differences in abundance of sessile invertebrates, herbivores, carnivores, and macrophytes in the low zone were not readily explained by local scale differences in hydrodynamic or physical conditions (wave forces, surge flow, or air temperature during low tide). Field experiments employing predator and herbivore manipulations and prey transplants suggested top-down (predation, grazing) processes varied positively with bottom-up processes (growth of filter-feeders, prey recruitment), but the basis for these differences was unknown. Shore-based sampling revealed that between-site differences were associated with nearshore oceanographic conditions, including phytoplankton concentration and productivity, particulates, and water temperature during upwelling. Further, samples taken at 19 sites along 380 km of coastline suggested that the differences documented between two sites reflect broader scale gradients of phytoplankton concentration. Among several alternative explanations, a coastal hydrodynamics hypothesis, reflecting mesoscale (tens to hundreds of kilometers) variation in the interaction between offshore currents and winds and continental shelf bathymetry, was inferred to be the primary underlying cause. Satellite imagery and offshore chlorophyll-a samples are consistent with the postulated mechanism. Our results suggest that benthic community dynamics can be coupled to pelagic ecosystems by both trophic and transport linkages.


Figures

Figure 1
Figure 1
Summaries (means ± 1 SEM) of community structure patterns, community dynamics, and physical conditions at wave-exposed sites at BB and SH. Sample numbers (numbers above error bars) were as follows: for community structure, quadrats; for predation and grazing, replicated experiments; for mussel recruitment, collectors/month; for mussel growth, transplant clumps (50 mussels/clump); for barnacle growth, individuals in each of two transplants/site; for wave force, daily measurements; for flow, 3 to 4-day measurements; and for air temperature, days of measurement. With the exception of grazing (F; see text) and temperature measurement (L), methods are in refs. , , and . Low tide air temperatures were obtained using battery-powered waterproof dataloggers (Alpha Omega model 9102). Analyses for differences between sites depended on the comparison. In all cases visual inspection indicated that residuals were normal and error terms were independent. All data were log- or arcsin-transformed before analysis. Probabilities: ∗∗∗, P < 0.0001; ∗∗, P < 0.001; ∗, P < 0.01; NS, not significantly different. Specific tests: for macrophytes and sessile invertebrates, MANOVA; for herbivore abundance, sea star abundance, sea star predation rate, herbivore grazing, mussel growth, and barnacle growth, ANOVA; for mussel recruitment, wave forces, and flow and temperature, repeated measures ANOVA. In MANOVA, probabilities were Bonferroni-adjusted by the number of tests (i.e., P = 0.05/2, or 0.025). Pairs of bars in E–H, J, and K indicate minimum and maximum values observed when studies were repeated in space (E, F, and H) or time (E, G, H, J, and K). In F, ordinate label is the difference in percent cover of microalgae in −grazer plots (E for exclosures) and +grazer plots (C for control).
Figure 2
Figure 2
Changes in phytoplankton and particulate organic material at BB and SH in summer 1993. Daily samples were taken during two relaxations (June 24 to July 3 and September 2–11); other values were monthly samples (note the time gaps on the abscissa). All measures were determined from replicated samples collected from shore at low tide in opaque HDPE plastic bottles (250 ml for Chl-a and particulates, 1000 ml for productivity). In 1993, a nested sampling design evaluated variation in Chl-a at different spatial scales: 1–2 m, tens of meters, hundreds of meters, and tens of kilometers (i.e., site). Differences between site accounted for most of the variance (usually 80–90%; ref. 30), so only site-level data are reported. (A) Chl-a was determined using a Turner Designs 10 fluorometer after extraction in 90% HPLC acetone for 12 hr in the dark at −20°C. (B) Phytoplankton primary production was estimated using light-dark bottle methodology with [14C]bicarbonate as a tracer (43). Six-hour incubations were done under simulated in situ conditions. Phytoplankton was collected on glass fiber filters, and radioactivity was determined using liquid scintillation counting. Productivity was calculated based on appropriate seasonal daylight periods as described in ref. . (C and D) Particulate material was collected on glass fiber filters and analyzed using a Carlo Erba CHN analyzer. Dissolved organic carbon was estimated from frozen filtered water samples using a Shimadzu gas chromatograph. SH estimates were significantly greater than those for BB in most samples (repeated measures ANOVA; sites differed at the P < 0.00001 level or more).
Figure 3
Figure 3
Offshore wind (direction, speed), onshore water temperature, and Chl-a levels at BB and SH in summer 1994. Wind data (A, B; readings taken at 11 a.m. or 2 p.m.) are from NOAA buoy NDBC 50, about 10 kilometers offshore from Newport, Oregon (44° 38′ N, 124° 02′ W). (C) Daily (higher high tide) water temperatures. Temperatures during the 18-day period from July 5 to July 23 were lower at BB (mean, 8.31°C vs. 9.12°C at SH; t = −4.0, 34 df, P = 0.0003). Temperatures during the 29-day period following this upwelling did not differ between sites (BB, 12.8°C; SH, 12.1°C; t = 1.59, 56 df, P = 0.12; assumptions of normal means and equal variances were met in both tests). (D) Chl-a (see ref. 30).
Figure 4
Figure 4
RNA:DNA ratios (A) and Chl-a levels (B) in summer 1995. Methods of measurement of RNA:DNA levels are given in ref. ; levels of Chl-a are given in ref. . Error bars are standard errors.
Figure 5
Figure 5
Continental shelf bathymetry (isobaths indicate 20-m depth intervals; contour furthest offshore is 200 m), Chl-a concentration of overlying waters (solid dots), and Chl-a concentrations at 16–19 sites along the Oregon coast from the Columbia River to Cape Blanco. Offshore Chl-a data from R. Emmett of NOAA (ref. 37).
Figure 6
Figure 6
Nutrients (nitrate, phosphate, silicate) at 15 sites (see Fig. 5 legend) on June 15 and September 1, 1994. Northern sites are at the left. Methods are described in refs. and . Among-site differences are highly significant (MANOVA; P ≪ 0.0001 with 84,301 df), but trends are not correlated to those of Chl-a (r ≤ 0.5, P > 0.05 in all cases; see Fig. 5).
Figure 7
Figure 7
Sea surface temperature (AVHRR) images off Oregon in summer 1996. Colder temperatures are blue, warmer are yellow and red. White areas are clouds. The left and center images were taken on upwelling days, and the right image was taken on a relaxation day. BB, SH, the town of Newport, and Cape Blanco are indicated.

References

    1. Levin S A. Ecology. 1992;73:1943–1967.
    1. Persson L, Bengtsson J, Menge B A, Power M E. In: Food Webs: Integration of Patterns & Dynamics. Polis G A, Winemiller K O, editors. New York: Chapman and Hall; 1995. pp. 396–434.
    1. Carpenter S R, editor. Complex Interactions in Lake Communities. New York: Springer; 1988.
    1. Paine R T, Levin S A. Ecol Monogr. 1981;51:145–178.
    1. Duggins D O, Simenstad C A, Estes J A. Science. 1989;245:170–173. - PubMed

LinkOut - more resources