Comparative Study
. 1997 Dec 23;94(26):14608-13.
doi: 10.1073/pnas.94.26.14608.

Comparative mapping of the human 22q11 chromosomal region and the orthologous region in mice reveals complex changes in gene organization

Affiliations
Comparative Study

Comparative mapping of the human 22q11 chromosomal region and the orthologous region in mice reveals complex changes in gene organization

A Puech et al. Proc Natl Acad Sci U S A. .

Abstract

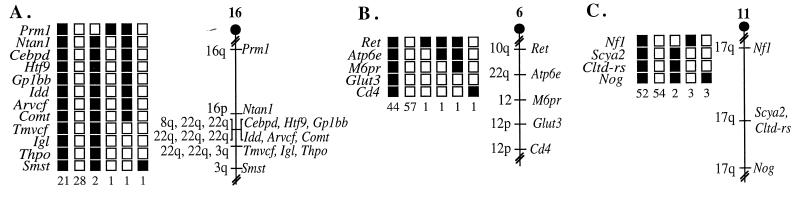
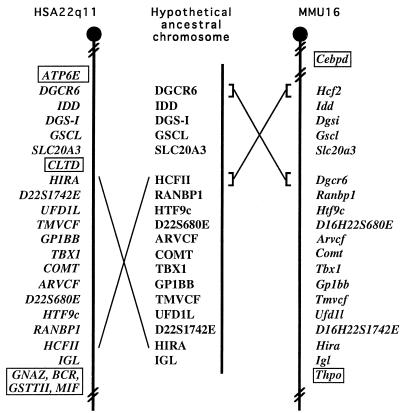
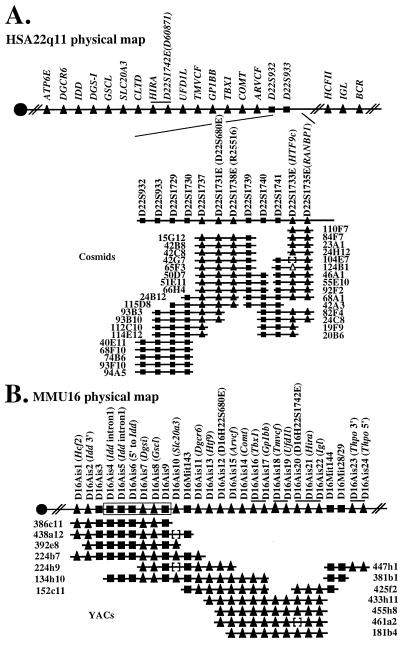
The region of human chromosome 22q11 is prone to rearrangements. The resulting chromosomal abnormalities are involved in Velo-cardio-facial and DiGeorge syndromes (VCFS and DGS) (deletions), "cat eye" syndrome (duplications), and certain types of tumors (translocations). As a prelude to the development of mouse models for VCFS/DGS by generating targeted deletions in the mouse genome, we examined the organization of genes from human chromosome 22q11 in the mouse. Using genetic linkage analysis and detailed physical mapping, we show that genes from a relatively small region of human 22q11 are distributed on three mouse chromosomes (MMU6, MMU10, and MMU16). Furthermore, although the region corresponding to about 2.5 megabases of the VCFS/DGS critical region is located on mouse chromosome 16, the relative organization of the region is quite different from that in humans. Our results show that the instability of the 22q11 region is not restricted to humans but may have been present throughout evolution. The results also underscore the importance of detailed comparative mapping of genes in mice and humans as a prerequisite for the development of mouse models of human diseases involving chromosomal rearrangements.


Figures

Figure 1
Figure 1
Genetic mapping of human 22q11 homologous genes on mouse chromosomes. The genes were placed on mouse chromosomes by interspecific backcross analysis. The segregation patterns of human 22q11 genes and flanking genes in backcross animals that were typed for all loci are shown at the left of each panel. For individual pairs of loci, more animals were typed. Each column represents the chromosome identified in the backcross progeny that was inherited from the (C57BL/6J X M. spretus) F1 parent. Shaded boxes represent the presence of a C57BL/6J allele, and white boxes represent the presence of an M. spretus allele. The number of offspring inheriting each type of chromosome is listed at the bottom of each column. Partial chromosome linkage maps showing the location of human 22q11 genes in relation to linked genes are shown at the right of each panel. The positions of loci on human chromosomes, where known, are shown to the left of the chromosome linkage maps. References for the human map positions of loci cited in this study can be obtained from GDB. (A) Gp1bb, Idd, Arvcf, Comt, and Tmvcf map to the proximal region of MMU16. Although 54 mice were analyzed for all markers and are shown in the segregation analysis, up to 185 mice were typed for some pairs of markers. The recombination frequencies expressed as genetic distances in cM ± the standard error are Prm1-2.4 ± 1.2-Ntan1-0.6 ± 0.6-[Cebpd, Htf9, Idd, Gp1bb, Arvcf, Comt]-0.6 ± 0.6-[Tmvcf, Igl, Thpo]-0.8 ± 0.8-Smst. No recombinants were detected between Cebpd and Htf9 in 185 mice typed in common, Htf9 and Gp1bb in 164 mice, Gp1bb and Idd in 141 mice, Idd and Arvcf in 158 mice, Arvcf and Comt in 180 mice, suggesting that the two loci in each pair are within 1.6, 1.8, 2.1, 1.9, and 1.7 cM of each other, respectively (upper 95% confidence limit). In addition, no recombinants were detected between Tmvcf and Igl in 161 mice typed in common or between Igl and Thpo in 176 mice, suggesting the two loci in each of these pairs are within 1.9 and 1.7 cM of each other, respectively (upper 95% confidence limit). (B) Atp6e maps to the distal region of MMU6. Although 105 mice were analyzed for all markers and are shown in the segregation analysis, up to 150 mice were typed for some pairs of markers. The recombination frequencies expressed as genetic distances in cM ± the standard error are Ret-0.7 ± 0.7-Atp6e-0.7 ± 0.7-M6pr-0.7 ± 0.7-Glut3-0.7 ± 0.7-Cd4. (C). Cltd-rs maps to the central region of MMU11. Although 114 mice were analyzed for all markers and are shown in the segregation analysis, up to 151 mice were typed for some pairs of markers. The recombination frequencies expressed as genetic distances in cM ± the standard error are Nfl-4.1 ± 1.6-[Scya2, Cltd-rs]-2.7 ± 1.3-Nog. No recombinants were detected between Scya2 and Cltd-rs in 134 animals typed in common, suggesting that the two loci are within 2.2 cM of each other (upper 95% confidence limit).
Figure 3
Figure 3
Comparison of the human VCFS/DGS region with the homologous region in mice. On the left is represented the relative order of genes from the HSA22q11 (this paper and refs. , , and 10). On the right is represented the relative order of genes in the homologous region in mice as shown by physical and genetic mapping. The distance between each marker is arbitrary. The middle portion of the figure shows the gene order of a hypothetical, ancestral chromosome and possible recombination events leading to the differences in the gene order in mice and humans (see text for details). Gene names within boxes in the map of one species indicate genes that are not present in the homologous region of the other species.
Figure 2
Figure 2
Physical map of a portion of MMU16 and HSA22q11. The markers used to construct the physical maps are indicated above the line representing either a portion of HSA22q11 (A) or MMU16 (B). For expressed sequences, the name of the gene or EST has been added in parentheses. The YAC and cosmid clones were ordered based upon the presence of genes (triangles) and monomorphic STS markers (squares). Closed symbols represent the markers that were tested and that are present on a particular clone, and open symbols represent markers that were not tested for the particular clone. The distance between each marker is arbitrary and does not reflect the actual physical distance. (A) Partial physical map of HSA22q11. The line at the top presents the relative order of genes from HSA22q11 as determined by high resolution physical mapping (6, 7). The markers used to extend the physical map are indicated above the line representing the region mapped in this study. (B) Physical map of the mouse region homologous with HSA22q11. A line above the symbols identifies genes or markers for which the relative order is not known. Order of markers D16Ais4 to D16Ais9 was inferred from the published 38-kb sequence of a portion of MMU16 (60).

References

    1. Biegel J A, Allen C S, Kawasaki K, Shimizu N, Budarf M L, Bell C J. Gene Chromosomes Cancer. 1996;16:94–105. - PubMed
    1. Iselius L, Lindsten J, Aurias A, Fraccaro M, Bastard C, Bottelli A M, Bui T H, Caufin D, Dalpra L, Delendi N, et al. Hum Genet. 1983;64:343–355. - PubMed
    1. Scambler P J, Kelly D, Lindsay E, Williamson R, Goldberg R, Shprintzen R, Wilson D I, Goodship J A, Cross I E, Burn J. Lancet. 1992;339:1138–1139. - PubMed
    1. Kelly D, Goldberg R, Wilson D, Lindsay E, Carey A, Goodship J, Burn J, Cross I, Shprintzen R J, Scambler P J. Am J Med Genet. 1993;45:308–312. - PubMed
    1. Driscoll D A, Salvin J, Sellinger B, Budarf M L, McDonald-McGinn D M, Zackai E H, Emanuel B S. J Med Genet. 1993;30:813–817. - PMC - PubMed

Publication types

LinkOut - more resources