. 1997 Dec 23;94(26):14626-31.
doi: 10.1073/pnas.94.26.14626.

DNA immunization: induction of higher avidity antibody and effect of route on T cell cytotoxicity

Affiliations

DNA immunization: induction of higher avidity antibody and effect of route on T cell cytotoxicity

J S Boyle et al. Proc Natl Acad Sci U S A. .

Abstract

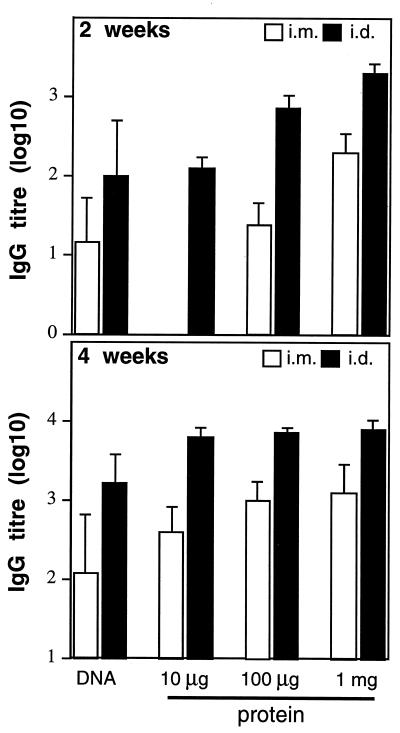
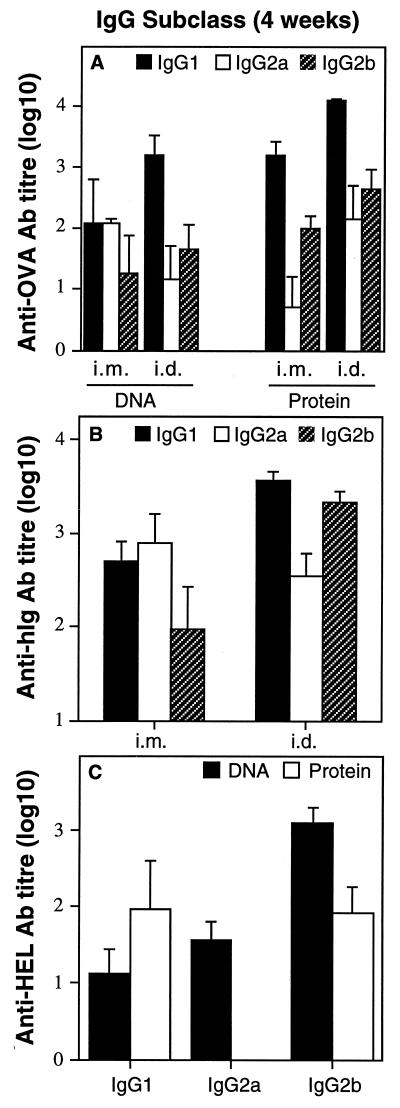
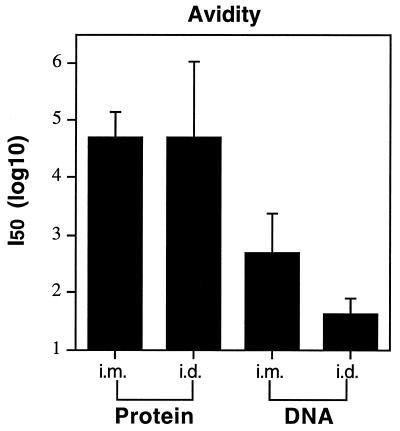
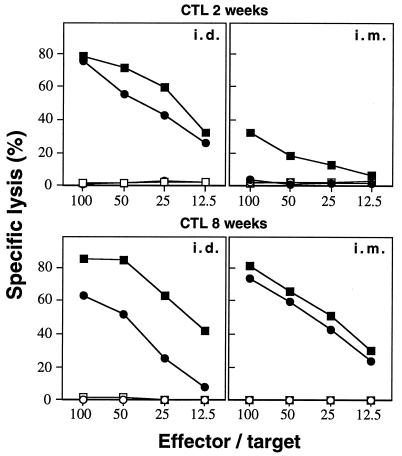
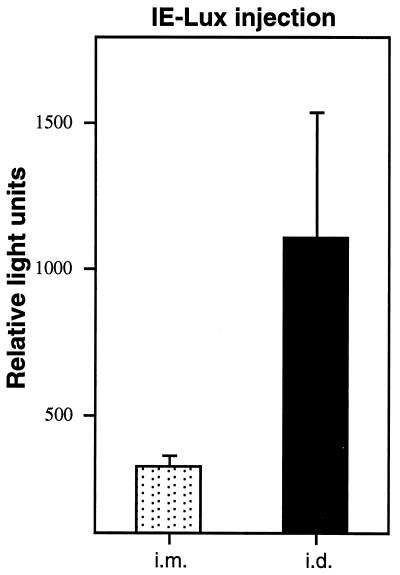
Immunizations of mice with plasmid DNAs encoding ovalbumin (OVA), human Ig, and hen egg lysozyme were compared with doses of soluble protein (without adjuvant) that induced similar IgG responses. The route of immunization influenced the magnitude of the antibody (Ab) response in that intradermal (i.d.) injection elicited higher IgG Ab levels than i.m. injection in both DNA- and protein-immunized mice. Although total IgG levels were similar to soluble protein controls, the avidity of the anti-OVA Abs generated by DNA immunization were 100- and 1,000-fold higher via the i.m. or i.d. route, respectively. However, despite the generation of high-avidity Ab in DNA-immunized mice, germinal centers could not be detected in either DNA- or protein-immunized mice. Examination of the IgG subclass response showed that IgG2a was induced by i.m. DNA immunization, coinciding with elevated interferon gamma production, whereas a dominant and elevated IgG1 response, coinciding with detectable interleukin 4 production, was generated after i.d. immunization with DNA or soluble OVA and hen egg lysozyme but not human Ig protein. As expected, cytotoxic T cell (CTL) responses could be detected only after DNA immunization. I.d. immunization produced the strongest CTL responses early (2 weeks) but was similar to i.m. later. Therefore, DNA immunization can differ from protein immunization by its ability to induce rapid CTL responses and higher avidity Ab, both of which are advantageous for vaccination.


Figures

Figure 1
Figure 1
Influence of the route of administration on the OVA-specific IgG responses. BALB/c mice were immunized i.m. or i.d. with 100 μg CIGH-OVA (DNA) or the indicated dose of OVA protein (protein) in normal saline. Sera were obtained at 2 and 4 weeks post-initial immunization (day 0) and stored at −20°C until assayed for OVA-specific IgG in an ELISA. Titers were defined as the highest dilution to give a 0.2 OD at 450 nm. Results are expressed as the mean of the log10 titer ± SEM from five mice in each group.
Figure 2
Figure 2
Influence of the route of administration on the IgG subclass responses. At 4 weeks post-initial immunization sera were obtained and assayed for Ag-specific IgG1, IgG2a, or IgG2b in an ELISA. Titers were defined as the highest dilution to reach an OD of 0.2 at 450 nm. (A) BALB/c mice were immunized with 100 μg of CIGH-OVA (DNA) or 100 μg of OVA protein (protein) in normal saline. Results are expressed as the mean of the log10 titer ± SEM from five mice in each group immunized with CIGH-OVA or OVA protein. (B) BALB/c mice were immunized with 100 μg of hIg encoding DNA in normal saline i.m. or i.d. Results are expressed as the mean of the log10 titer ± SEM from six mice in each group. (C) BALB/c mice were immunized i.m. with 100 μg of CIGH-HEL (DNA) or 25 μg of HEL protein (protein) in normal saline. Results are expressed as the mean of the log10 titer ± SEM from five mice immunized with HEL protein and from 16 mice immunized with CIGH-HEL.
Figure 3
Figure 3
Avidity of the antibody induced after DNA or protein immunization. Sera were obtained from BALB/c mice immunized with 100 μg of CIGH-OVA (DNA) or 100 μg of OVA protein (protein) in normal saline. The avidity is reported as the log of the concentration (10 mg/ml OVA was the highest concentration used) added to the well that resulted in a 50% binding inhibition of each immune sera control (I50). Results shown are the mean I50 ± SEM from five mice in each group.
Figure 4
Figure 4
Kinetics of the CTL response in DNA-immunized mice. Splenocytes from BALB/c × C57BL/6 mice were taken 2 or 8 weeks postimmunization with CIGH-OVA, restimulated in vitro for 5 days, and tested for their ability to lyse EG7 (solid symbols) or control EL4 (open symbols) in a standard 51Cr release assay. Results shown are from two representative animals at each time point. No specific lysis of EG7 or EL4 cells was seen with naive control animals.
Figure 5
Figure 5
Lux expression after injection of IE-lux DNA. Mice were injected with 100 μg of IE-lux i.m. into both quadriceps or i.d. at the base of the tail. The entire muscle or injected skin area was removed 5 days later to determine the lux activity. Results shown are the mean ± SEM relative light units from eight injected muscles and four skin samples. Background activity in uninjected tissues was 306 ± 28 for muscle and 377 ± 71 for skin.

References

    1. Wolff J A, Williams P, Acsadi G, Jiao S, Jani A, Chong W. Biotechniques. 1991;11:474–485. - PubMed
    1. Raz E, Carson D A, Parker S E, Parr T B, Abai A M, Aichinger G, Gromkowski S H, Singh M, Lew D, Yankauckas M A, Baird S M, Rhodes G H. Proc Natl Acad Sci USA. 1994;91:9519–9523. - PMC - PubMed
    1. Tang D C, De Vit M, Johnston S A. Nature (London) 1992;356:152–154. - PubMed
    1. Yankauckas M A, Morrow J E, Parker S E, Abai A, Rhodes G H, Dwarki V J, Gromkowski S H. DNA Cell Biol. 1993;12:771–776. - PubMed
    1. Donnelly J J, Ulmer J B, Liu M A. Life Sci. 1997;60:163–172. - PubMed

Publication types