

Analysis of genomic alterations in benign, atypical, and anaplastic meningiomas: toward a genetic model of meningioma progression
- PMID: 9405679
- PMCID: PMC25103
- DOI: 10.1073/pnas.94.26.14719
Analysis of genomic alterations in benign, atypical, and anaplastic meningiomas: toward a genetic model of meningioma progression
Abstract
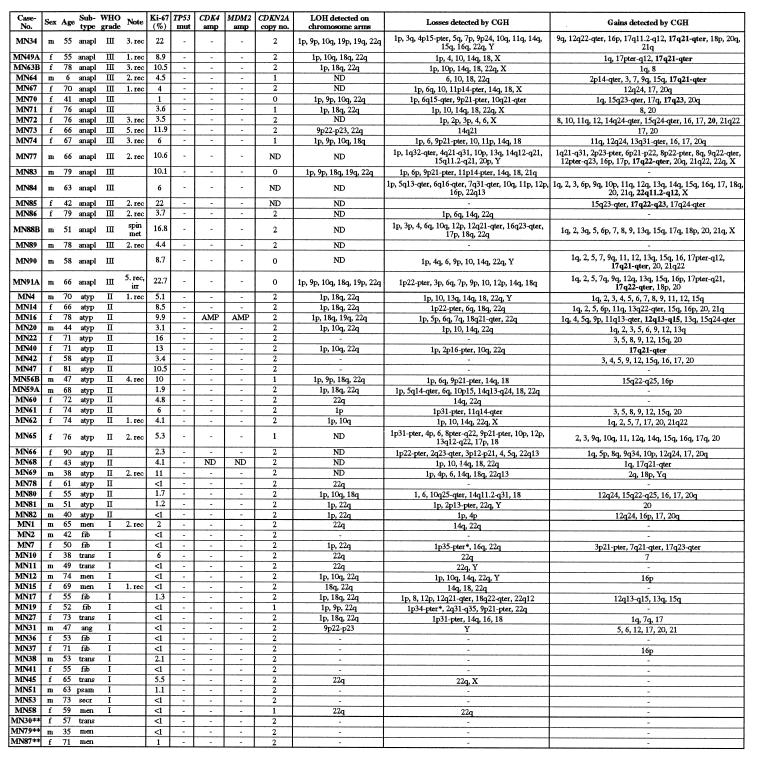
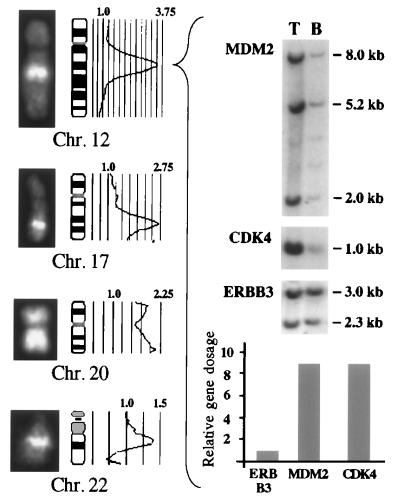
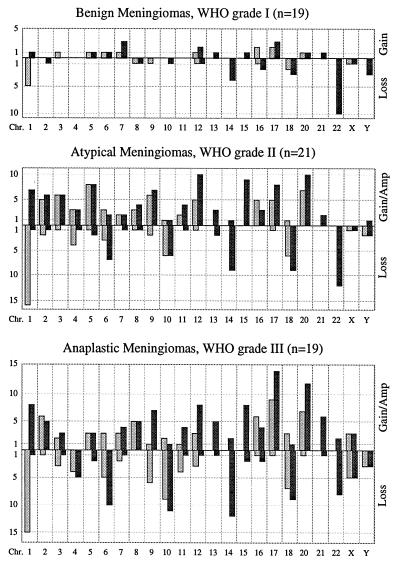
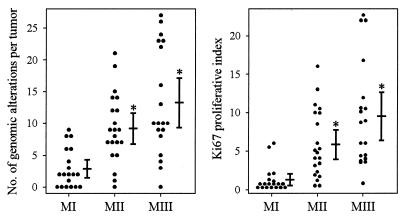
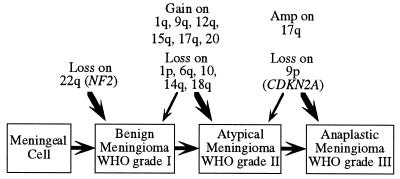
Nineteen benign [World Health Organization (WHO) grade I; MI], 21 atypical (WHO grade II; MII), and 19 anaplastic (WHO grade III; MIII) sporadic meningiomas were screened for chromosomal imbalances by comparative genomic hybridization (CGH). These data were supplemented by molecular genetic analyses of selected chromosomal regions and genes. With increasing malignancy grade, a marked accumulation of genomic aberrations was observed; i.e., the numbers (mean +/- SEM) of total alterations detected per tumor were 2.9 +/- 0.7 for MI, 9.2 +/- 1.2 for MII, and 13.3 +/- 1.9 for MIII. The most frequent alteration detected in MI was loss on 22q (58%). In MII, aberrations most commonly identified were losses on 1p (76%), 22q (71%), 14q (43%), 18q (43%), 10 (38%), and 6q (33%), as well as gains on 20q (48%), 12q (43%), 15q (43%), 1q (33%), 9q (33%), and 17q (33%). In MIII, most of these alterations were found at similar frequencies. However, an increase in losses on 6q (53%), 10 (68%), and 14q (63%) was observed. In addition, 32% of MIII demonstrated loss on 9p. Homozygous deletions in the CDKN2A gene at 9p21 were found in 4 of 16 MIII (25%). Highly amplified DNA sequences were mapped to 12q13-q15 by CGH in 1 MII. Southern blot analysis of this tumor revealed amplification of CDK4 and MDM2. By CGH, DNA sequences from 17q were found to be amplified in 1 MII and 8 MIII, involving 17q23 in all cases. Despite the high frequency of chromosomal aberrations in the MII and MIII investigated, none of these tumors showed mutations in exons 5-8 of the TP53 gene. On the basis of the most common aberrations identified in the various malignancy grades, a model for the genomic alterations associated with meningioma progression is proposed.
Figures
References
-
- Lantos P L, VandenBerg S R, Kleihues P. Tumors of the Nervous System. London: Arnold; 1996.
-
- Kleihues P, Burger P D, Scheithauer B W. Histological Typing of Tumors of the Central Nervous System. World Health Organization International Histological Classification of Tumors. Berlin, Heidelberg: Springer; 1993.
-
- Maier H, Ofner D, Hittmair A, Kitz K, Budka H. J Neurosurgery. 1992;77:616–623. - PubMed
-
- Zang K D, Singer H. Nature (London) 1967;216:84–85. - PubMed
-
- Mark K, Levan G, Mitelman F. Hereditas. 1972;71:163–168. - PubMed
Publication types
MeSH terms
LinkOut - more resources
Full Text Sources
Research Materials
Miscellaneous
