. 1997 Dec 23;94(26):14848-53.
doi: 10.1073/pnas.94.26.14848.

Targeted gene deletion of heme oxygenase 2 reveals neural role for carbon monoxide

Affiliations

Targeted gene deletion of heme oxygenase 2 reveals neural role for carbon monoxide

R Zakhary et al. Proc Natl Acad Sci U S A. .

Abstract

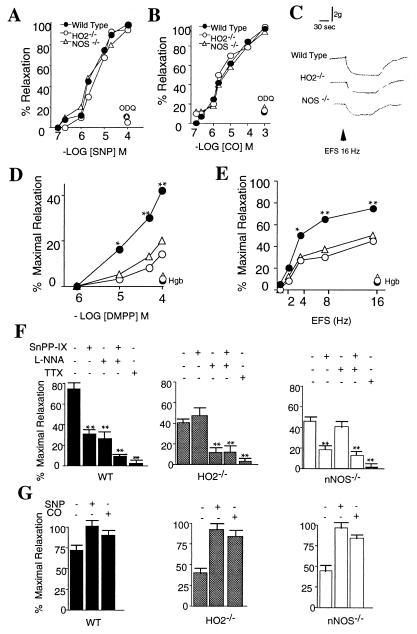
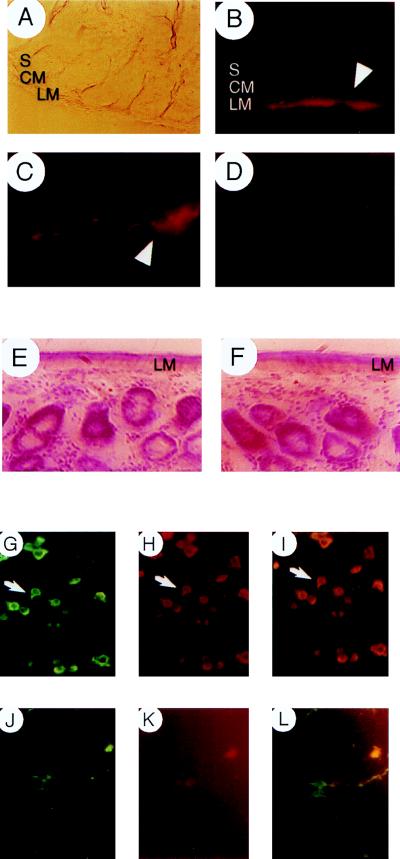
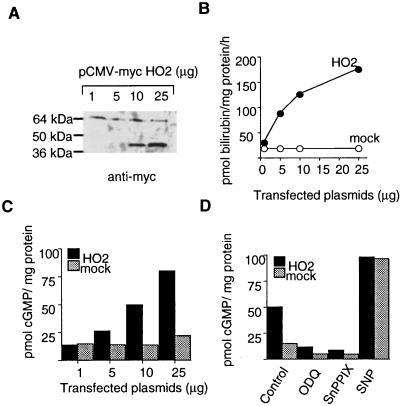
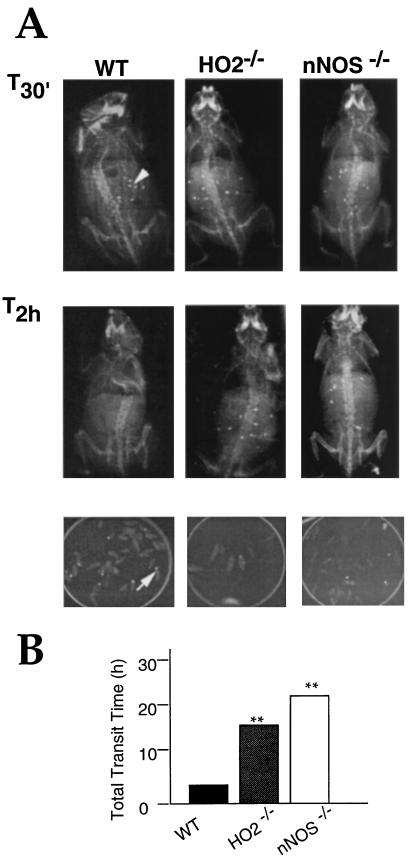
Neuronal nitric oxide synthase (nNOS) generates NO in neurons, and heme-oxygenase-2 (HO-2) synthesizes carbon monoxide (CO). We have evaluated the roles of NO and CO in intestinal neurotransmission using mice with targeted deletions of nNOS or HO-2. Immunohistochemical analysis demonstrated colocalization of nNOS and HO-2 in myenteric ganglia. Nonadrenergic noncholinergic relaxation and cyclic guanosine 3',5' monophosphate elevations evoked by electrical field stimulation were diminished markedly in both nNOSDelta/Delta and HO-2(Delta)/Delta mice. In wild-type mice, NOS inhibitors and HO inhibitors partially inhibited nonadrenergic noncholinergic relaxation. In nNOSDelta/Delta animals, NOS inhibitors selectively lost their efficacy, and HO inhibitors were inactive in HO-2(Delta)/Delta animals.


Figures

Figure 2
Figure 2
Intestinal relaxation in mice lacking either HO-2 or neuronal NOS. (A and B) Concentration–response curves of enteric muscle from wild-type and mutant mice to SNP (10−7–10−4 M) and CO (10−7–10−3 M) and ODQ (10−5 M). Results are expressed as a percentage of the relaxation of wild-type muscle to SNP 10−4 M (100%). SE ranged between 5 and 11%, n = 5–7 (see Materials and Methods). Because the responses of congenic controls for either HO-2 or nNOS mutant mice were not statistically different, in all figures wild-type responses are expressed as an average of both HO-2+/+ and nNOS+/+ mice. (C) Typical traces from intestinal segments after EFS (16 Hz). (D and E) NANC relaxation in ileal segments after addition of DMPP (10−6–10−4 M) or EFS (2–16 Hz). Results are expressed as a percentage of the mean maximal relaxation achieved with SNP 10−4 M in wild-type tissues. SE ranged between 4 and 13%. (BG) In each experiment, control strips were treated with SNP (10−4 M) as in A, and in all cases, maximal relaxations were essentially the same as in A. At the completion of each experiment, strips were treated with SNP 10−4 M to confirm the integrity of smooth muscle responses. Asterisks denote significant differences between wild-type responses and those of both HO-2Δ/Δ and nNOSΔ/Δ mice. Note: Strips were stimulated only once, and values represent the mean of seven to nine independent experiments. (∗, P < 0.05; ∗∗, P < 0.01 between wild-type mice and both nNOS and HO-2 mutants, ANOVA). Hgb, hemoglobin (10−3 M). (F) Effect of pharmacologic inhibition of NOS and HO on EFS-induced NANC relaxations in wild-type and mutant mice. Results are expressed as a percentage of the mean maximal wild-type relaxations to SNP 10−4 M in A. NANC relaxation was elicited with EFS (16 Hz, 2 ms) (n = 7). SnPP-IX, 10−5 M; L-NNA, 10−4 M; CO, 10−4 M; SNP, 10−4 M. SnPP-IX and L-NNA exerted no significant effects on baseline tensions. (G) Effect of CO and SNP on EFS-induced NANC relaxation. Results are expressed as a percentage of the mean maximal wild-type relaxations to SNP 10−4 M in A. (n = 7; ∗∗, P < 0.01, compared to untreated controls. Student’s t test for unpaired observations.) Experiments with DMPP yielded similar results.
Figure 1
Figure 1
HO-2 and nNOS expression in the enteric nervous system. (A) Nomarski view of ileum from wild-type mouse. S, submucosa; CM, circular muscle; LM, longitudinal muscle. (B and C) HO-2 expression in myenteric ganglia (arrowheads) in wild-type mice. (B) Low power magnification. (C) High power magnification. (D) No HO-2 immunoreactivity is observed in HO-2 Δ/Δ mice. (E and F) Cross-sections of ilea from (E) wild-type and (F) HO-2 mutants stained with nuclear red for histochemical analysis. (Bottom) Colocalization of HO-2 and nNOS. Doubly labeled myenteric ganglia (arrows denote example) from colchicine-treated ilea of wild-type mice with (G) anti-HO-2 and (H) anti-nNOS, double exposure (I). Rat primary cortical neurons doubly labeled with (J) anti-HO-2 and (K) anti-nNOS, double exposure (L). For additional controls, see Materials and Methods. Double labeling with two different NOS antibodies yielded similar results.
Figure 3
Figure 3
Modulation of cGMP by HO-2. HEK-293 cells were transfected with cDNAs encoding either pCMV-mycHO-2 or parent vector. (A) Expression of pCMV-mycHO-2 was assessed by immunoblotting. (B) Activity was determined by measuring the conversion of [3H]iron mesoporphyrin into [3H]bilirubin. In A, the band at 64 kDa is an endogenous protein that is recognized by the anti-myc antibody; the band slightly >36 kDa is myc-tagged HO-2. (C) Increasing concentrations of HO-2 (1–25 μg) were transfected, and cGMP levels were determined. (D) Effects of inhibitors of HO and guanylyl cyclase on cGMP levels in cells transfected with 10 μg DNA. SE ranged between 7 and 15 pmol of cGMP/mg protein.
Figure 4
Figure 4
Gastrointestinal transit in HO-2Δ/Δ and NOSΔ/Δ mice. (A) Ten to 15 radiopaque markers (arrow) were fed to mice and tracked by radiography at periodic intervals. Excretion of markers was also monitored by x-ray (Bottom). (B) Average time to excrete all markers. Results are expressed as number of hours from marker consumption to excretion. (∗∗, P < 0.01, n = 7–11. Student’s t test for unpaired observations.)

References

    1. Maines M D. Annu Rev Pharmacol Toxicol. 1997;37:517–554. - PubMed
    1. Jaffrey S R, Snyder S H. Annu Rev Cell Dev Biol. 1995;11:417–440. - PubMed
    1. Bult H, Boeckxstaens G E, Pelckmans P A, Jordaens F H, Van Maercke Y M, Herman A G. Nature (London) 1990;345:346–347. - PubMed
    1. Verma A, Hirsch D J, Glatt C E, Ronnett G V, Snyder S H. Science. 1993;259:381–384. - PubMed
    1. Bredt D S, Hwang P M, Snyder S H. Nature (London) 1990;347:768–770. - PubMed

Publication types

LinkOut - more resources