

Tissue and zonal-specific expression of an olfactory receptor transgene
- PMID: 9412503
- PMCID: PMC6793424
- DOI: 10.1523/JNEUROSCI.18-01-00227.1998
Tissue and zonal-specific expression of an olfactory receptor transgene
Abstract
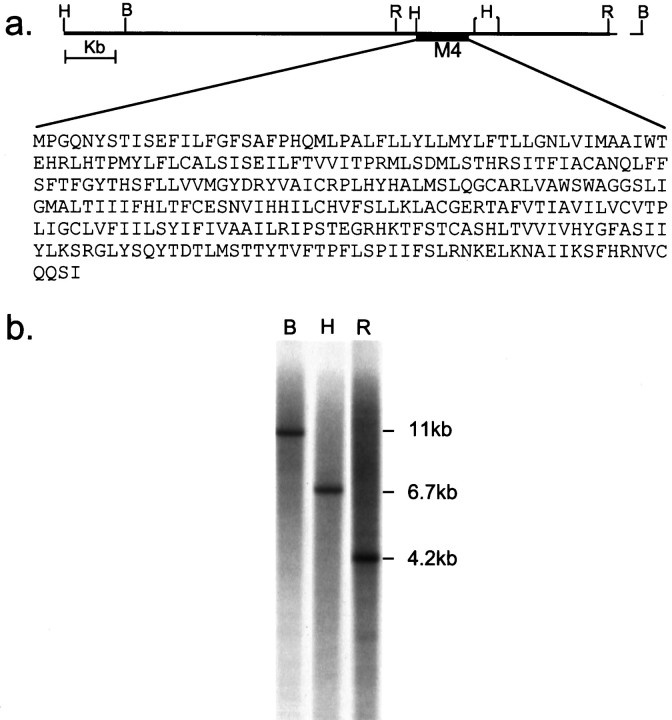
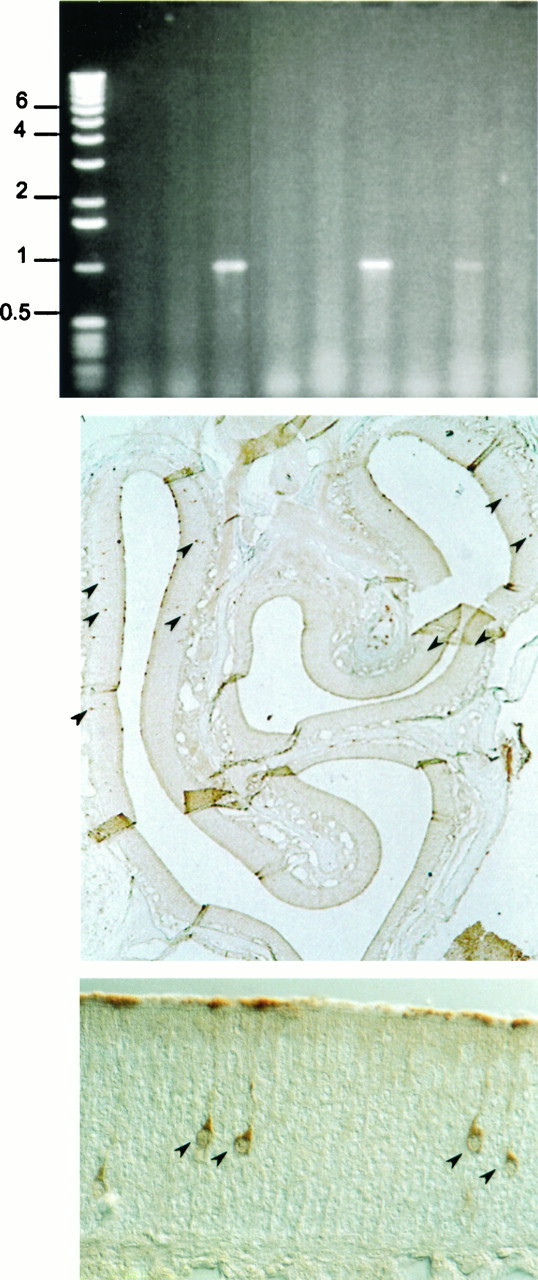
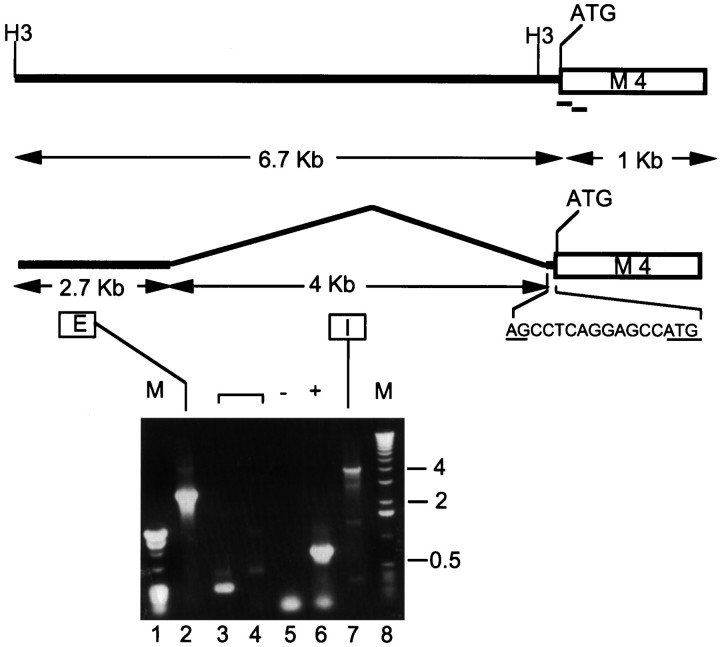
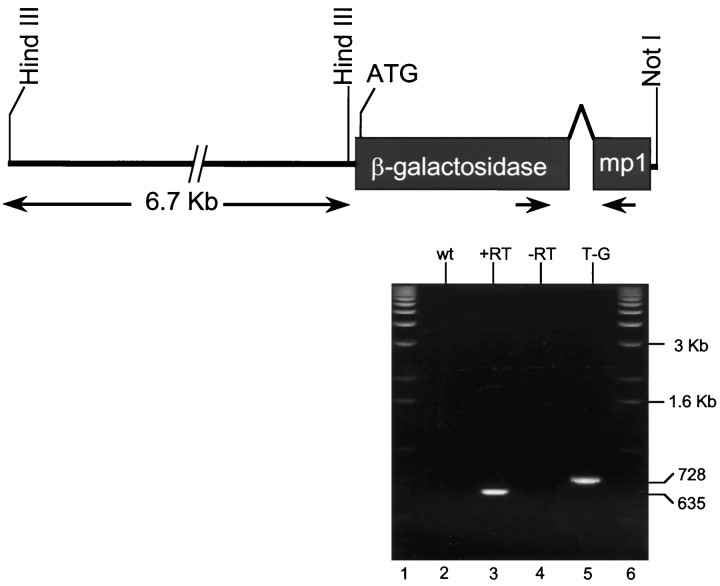
Discrimination of odorants is thought to arise from the selective expression of one of a small number of individual receptors in any single olfactory neuron. Receptor genes are expressed in a small subset of neurons throughout a zonally restricted region of the sensory epithelium. We demonstrate that a 6.7 kb region upstream of the M4 olfactory receptor coding region was sufficient to direct expression in olfactory epithelium. Moreover, reporter expression recapitulated the zonal restriction and distributed neuronal expression observed for endogenous olfactory receptors. Transgenic lines were obtained that directed expression in two different receptor zones, one of which was identical to the endogenous M4 receptor. When the reporter was expressed in the same zone as the endogenous M4 receptor, the two expression patterns were, in large part, nonoverlapping. These results suggest a model in which important regulatory elements are located in close proximity to transcription initiation sites of the olfactory receptor genes and receive information defining zonal patterning via long-range processes.
Figures
Similar articles
-
The OMP-lacZ transgene mimics the unusual expression pattern of OR-Z6, a new odorant receptor gene on mouse chromosome 6: implication for locus-dependent gene expression.J Neurosci. 2001 Jul 1;21(13):4637-48. doi: 10.1523/JNEUROSCI.21-13-04637.2001. J Neurosci. 2001. PMID: 11425891 Free PMC article.
-
Minigenes impart odorant receptor-specific axon guidance in the olfactory bulb.Neuron. 2002 Aug 15;35(4):681-96. doi: 10.1016/s0896-6273(02)00793-6. Neuron. 2002. PMID: 12194868
-
The promoter of the mouse odorant receptor gene M71.Mol Cell Neurosci. 2005 Mar;28(3):535-46. doi: 10.1016/j.mcn.2004.11.006. Mol Cell Neurosci. 2005. PMID: 15737743
-
Odorant receptor diversity and patterned gene expression in the mammalian olfactory epithelium.Prog Clin Biol Res. 1994;390:75-84. Prog Clin Biol Res. 1994. PMID: 7724652 Review.
-
Receptor diversity and spatial patterning in the mammalian olfactory system.Ciba Found Symp. 1993;179:51-64; discussion 64-7, 88-96. doi: 10.1002/9780470514511.ch4. Ciba Found Symp. 1993. PMID: 8168382 Review.
Cited by
-
Random and non-random monoallelic expression.Neuropsychopharmacology. 2013 Jan;38(1):55-61. doi: 10.1038/npp.2012.85. Epub 2012 Jul 4. Neuropsychopharmacology. 2013. PMID: 22763620 Free PMC article. Review.
-
Olfactory neurons expressing closely linked and homologous odorant receptor genes tend to project their axons to neighboring glomeruli on the olfactory bulb.J Neurosci. 1999 Oct 1;19(19):8409-18. doi: 10.1523/JNEUROSCI.19-19-08409.1999. J Neurosci. 1999. PMID: 10493742 Free PMC article.
-
High-throughput microarray detection of olfactory receptor gene expression in the mouse.Proc Natl Acad Sci U S A. 2004 Sep 28;101(39):14168-73. doi: 10.1073/pnas.0405350101. Epub 2004 Sep 17. Proc Natl Acad Sci U S A. 2004. PMID: 15377787 Free PMC article.
-
A purely bioinformatic pipeline for the prediction of mammalian odorant receptor gene enhancers.BMC Bioinformatics. 2019 Sep 14;20(1):474. doi: 10.1186/s12859-019-3012-1. BMC Bioinformatics. 2019. PMID: 31521109 Free PMC article.
-
Genomic analysis of the olfactory receptor region of the mouse and human T-cell receptor alpha/delta loci.Genome Res. 2002 Jan;12(1):81-7. doi: 10.1101/gr.197901. Genome Res. 2002. PMID: 11779833 Free PMC article.
References
-
- Amoore JE. Molecular basis of odor. Thomas; Springfield, IL: 1970.
-
- Benkel BF, Perreault J, Gagnon C, Conklin K. A rapid PCR-based test for the endogenous viral element ev3 of chickens. Anim Genet. 1995;26:189–191. - PubMed
-
- Buck LB. The olfactory multigene family. Curr Opin Genet Dev. 1992;2:467–473. - PubMed
-
- Buck L, Axel R. A novel multigene family may encode odorant receptors: a molecular basis for odor recognition. Cell. 1991;66:175–187. - PubMed
-
- Chess A, Simon I, Cedar H, Axel R. Allelic inactivation regulates olfactory receptor gene expression. Cell. 1994;78:823–824. - PubMed
MeSH terms
Substances
LinkOut - more resources
Full Text Sources
Other Literature Sources
Molecular Biology Databases