Comparative Study
. 1998 Jan 1;18(1):399-410.
doi: 10.1523/JNEUROSCI.18-01-00399.1998.

A model that accounts for activity in primate frontal cortex during a delayed matching-to-sample task

Affiliations
Comparative Study

A model that accounts for activity in primate frontal cortex during a delayed matching-to-sample task

S L Moody et al. J Neurosci. .

Abstract

A fully recurrent neural network model was optimized to perform a spatial delayed matching-to-sample task (DMS). In DMS, a stimulus is presented at a sample location, and a match is reported when a subsequent stimulus appears at that location. Stimuli elsewhere are ignored. Computationally, a DMS system could consist of memory and comparison components. The model, although not constrained to do so, worked by using two corresponding classes of neurons in the hidden layer: storage and comparator units. Storage units form a dynamical system with one fixed point attractor for each sample location. Comparator units constitute a system receiving input from these storage units as well as from current input stimuli. Both unit types were tuned directionally. These two sources of information combine to create unique patterns of activity that determine whether a match has occurred. In networks with abundant hidden units, the storage and comparator functions were distributed so that individual units took part in both. We compared the model with single-neuron recordings from premotor (PM) and prefrontal (PF) cortex. As shown previously, many PM and PF neurons behaved like storage units. In addition, both regions contain neurons that behave like the comparator units of the model and appear to have dual functionality similar to that observed in the model units. No neuron in either area had properties identical to those of the match output neuron of the model. However, four PF neurons and one PM neuron resembled the output signal more closely than any of the hidden units of the model.


Figures

Fig. 1.
Fig. 1.
Diagram of the recurrent network model. Eachlarge, sigmoid-containing triangle represents a soma or a model unit, which receives external input and feedback from other network units. The activation of a model unit is determined by performing a nonlinear operation on the weighted sum of its inputs (see Eq. 1). Inputs are shown in thebottom left corner and labeled x,y, and gate, respectively. For clarity, only five model units are shown here; actual network models contained between 9 and 50 of these units. The black diamondsrepresent the wij; white diamonds represent output unit weights. The three small, sigmoid-containing triangles labeled match,x, and y represent the output units. The activation of an output unit is determined by a nonlinear operation on the weighted sum of the hidden unit activity.
Fig. 2.
Fig. 2.
Schematic of training algorithm used for delayed match-to-sample network. The row ofcircles represents the input coordinate stimuli, and thebottom line represents the output match response. Thetop line represents the gate signal. There are eight possible input coordinates, represented by the small lines on the circles. A solid circle indicates an input stimulus pattern; an outlined circle indicates a gated stimulus pattern. The output match unit indicates when the current input matches the last gated input. The output also carries a copy of the last gated location, which is not shown. Each gated sample input is followed by a pseudorandom number of distractors. The number of distractors, n, decreases exponentially as n increases and is determined as the probability, p(n), that the number of test patterns is n =k(n − 1)(1 - −k), where k was set to 0.35. In addition, there was an interstimulus interval of either two or three (0,0) inputs separating each new input stimuli.
Fig. 3.
Fig. 3.
Typical temporal behavior of a the storage unit of a model, shown as unit activity plotted as a function of time. Att = 5, a sample stimulus pattern is gated in, and at t = 17, the same stimulus is presented again. Both events are marked with arrows, and dotted vertical lines demarcate the delay period. The top plot shows the sustained response for a subset of input patterns (sample stimuli at locations 8 and 1–3); the bottom plot shows the sustained response for the remaining inputs (sample stimuli at locations 4–7). In this and most subsequent figures, model unit activity levels are normalized to the range [0.0–1.0].
Fig. 4.
Fig. 4.
Temporal behavior of a storage unit across multiple gated sample input patterns. Each arrow along the x-axis indicates gating in of a new sample pattern. At t = 6 and 25 a “preferred” sample location was gated in; at t = 17 a nonpreferred sample location was presented.
Fig. 5.
Fig. 5.
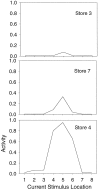
Model comparator unit for three different stored values. The response to current stimuli, matches, and distractors at locations 1–8 when the sample has previously appeared at location 3 is shown in the top plot. The middle andbottom plots show the response to current stimuli at the same locations for sample stimulus locations 7 and 4, respectively.
Fig. 6.
Fig. 6.
Steady-state values of the network, for a minimal network, shown as activation profiles of the nine model neurons across eight input patterns. The activation shown is after the network has settled to a steady state. C, Comparator cell;S, storage unit. Note how one unit (bottom left corner) does not distinguish among the different input patterns.
Fig. 7.
Fig. 7.
Spatial extent of the basins of attraction for model networks and the effects of lesions on attractor basins.A, Minimal, nine-unit network. B, Fifty-unit network. C, Nine-unit network with a lesioned comparator unit. D, Nine-unit network with a lesioned storage unit. Steady network state activation is plotted as a function of the location of the gated-in (x,y) coordinate sample stimulus across a matrix of 57 × 57 (x andy ranged from [−0.2:1.2], with a step of 0.025). The network settled for 25 activation sweeps after each gated coordinate position. The various colors serve to distinguish one attractor basin from another; there is no correlation between hue and relative distances among attractor basins. The small white circles indicate the eight training target locations. Note that, because of storage unit activity, the basins of attraction remain stable with a comparator lesion (compare A,C). Note the serious disruption of several basins of attraction with a storage unit lesion (compare A,D), including one large basin that now subsumes three of the eight locations in the sample stimulus training set.
Fig. 8.
Fig. 8.
Higher-resolution map of a boundary between two basins of attraction. These plots show an x range of [0.670–0.794], a y range of [0.540–0.664], and a step size of 0.002 (vs 0.025 in Fig. 7). Left, Each hidden unit was initialized with a different random value.Right, Each hidden unit was initialized with the same value.
Fig. 9.
Fig. 9.
A storage unit from PM. Average neuronal activity for stimuli at each of the eight locations in the training set (rows 1–8). Left column, Activity aligned on the onset of the sample stimulus. Middle column, Activity aligned on the onset of a distractor stimulus.Right column, activity aligned on the onset of a match stimulus. Each trace is an average across a variable number of trials, plotted to the same scale (activity scale is in impulses per second). Top row, Average for each column.
Fig. 10.
Fig. 10.
Tuning curve for PM cell illustrated in Figure 9. Activity and SE/SD for activity during the delay period (for the 750 msec period immediately preceding match stimulus onset) across stimulus location.
Fig. 11.
Fig. 11.
Comparator unit from PM. Format is as in Figure9.
Fig. 12.
Fig. 12.
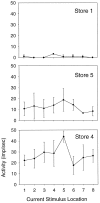
Tuning curves for PM cell illustrated in Figure11. As in Figure 5 from the model, each plot shows the response to stimuli at one of the eight locations in the training set after a sample at one location. Top, middle, bottom, Sample stimulus at locations 1, 5, and 4, respectively.
Fig. 13.
Fig. 13.
Schematic of tuning properties described by the directional selectivity (si) and depth-of-tuning (di) indices (see Eqs. 2, 3).
Fig. 14.
Fig. 14.
Directional selectivity index versus depth-of-tuning index for PM neurons, PF neurons, and model neurons. The diameter of each data point is proportional to the normalized activity modulation (mi) after the match stimulus event. Because of the unusually large modulation of activity for one PF neuron (>200 impulses/sec), the rest of the PF population appears to have minimal modulation. However, this is merely a result of normalization to the maximum value.

References

    1. Amit DJ, Brunel N. Learning internal representations in an attractor neural network with analogue neurons. Network. 1995;6:359–388.
    1. Cohen JD, Perlstein WM, Braver TS, Nystrom LE, Noll DC, Jonides J, Smith EE. Temporal dynamics of brain activation during a working memory task. Nature. 1997;386:604–608. - PubMed
    1. Courtney SM, Ungerleider LG, Kiel K, Haxby JV. Transient and sustained activity in a distributed neural system for human working memory. Nature. 1997;386:608–611. - PubMed
    1. Cowan JD. Stochastic of neuroelectric activity. In: Ricce SA, Fread KF, Light JC, editors. Statistical mechanics. Chicago UP; Chicago: 1972. pp. 181–182.
    1. Crammond DJ, Kalaska JF. Neuronal activity in primate parietal cortex area 5 varies with intended movement direction during an instructed-delay period. Exp Brain Res. 1989;76:458–462. - PubMed

Publication types

MeSH terms