

Imbalance of the interleukin 1 system in colonic mucosa--association with intestinal inflammation and interleukin 1 receptor antagonist [corrected] genotype 2
- PMID: 9414973
- PMCID: PMC1891562
- DOI: 10.1136/gut.41.5.651
Imbalance of the interleukin 1 system in colonic mucosa--association with intestinal inflammation and interleukin 1 receptor antagonist [corrected] genotype 2
Erratum in
- Gut 1998 Mar;42(3):450
Abstract
Background: Interleukin 1 (IL-1) alpha and beta are potent cytokines which play key roles in inflammation. They are controlled by IL-1 receptor antagonist (IL-1ra).
Aims: To investigate the influence of mucosal inflammation and IL-1ra genotype on the IL-1ra:IL-1 balance.
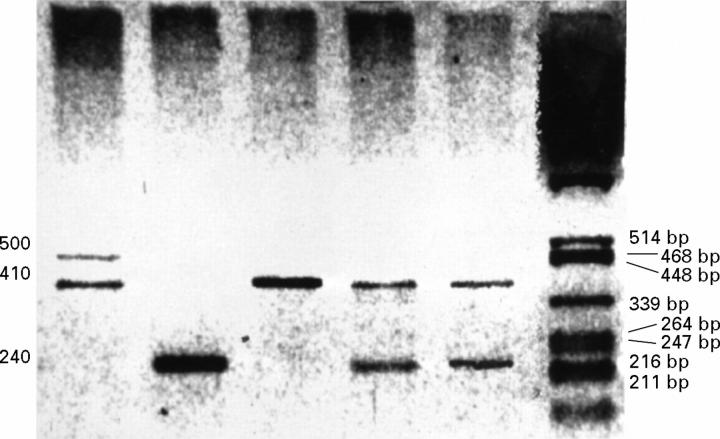
Patients and methods: IL-1 alpha, IL-1 beta, and IL-1ra were measured by enzyme linked immunosorbent assay (ELISA) in biopsy specimens taken from inflamed and non-inflamed colon of 60 patients with Crohn's disease (CD), 34 with ulcerative colitis (UC), 15 inflammatory controls, and 103 non-inflamed controls. IL-1ra genotype was determined by polymerase chain reaction and gel electrophoresis.
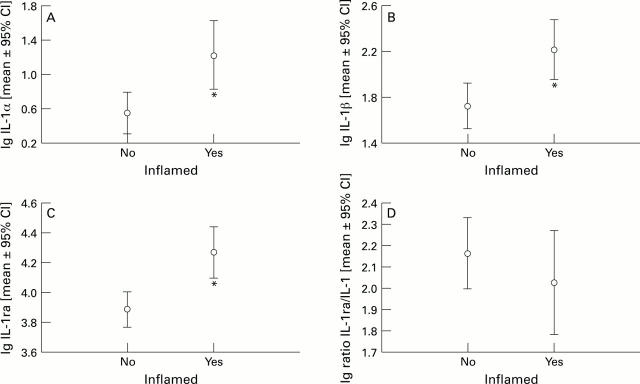
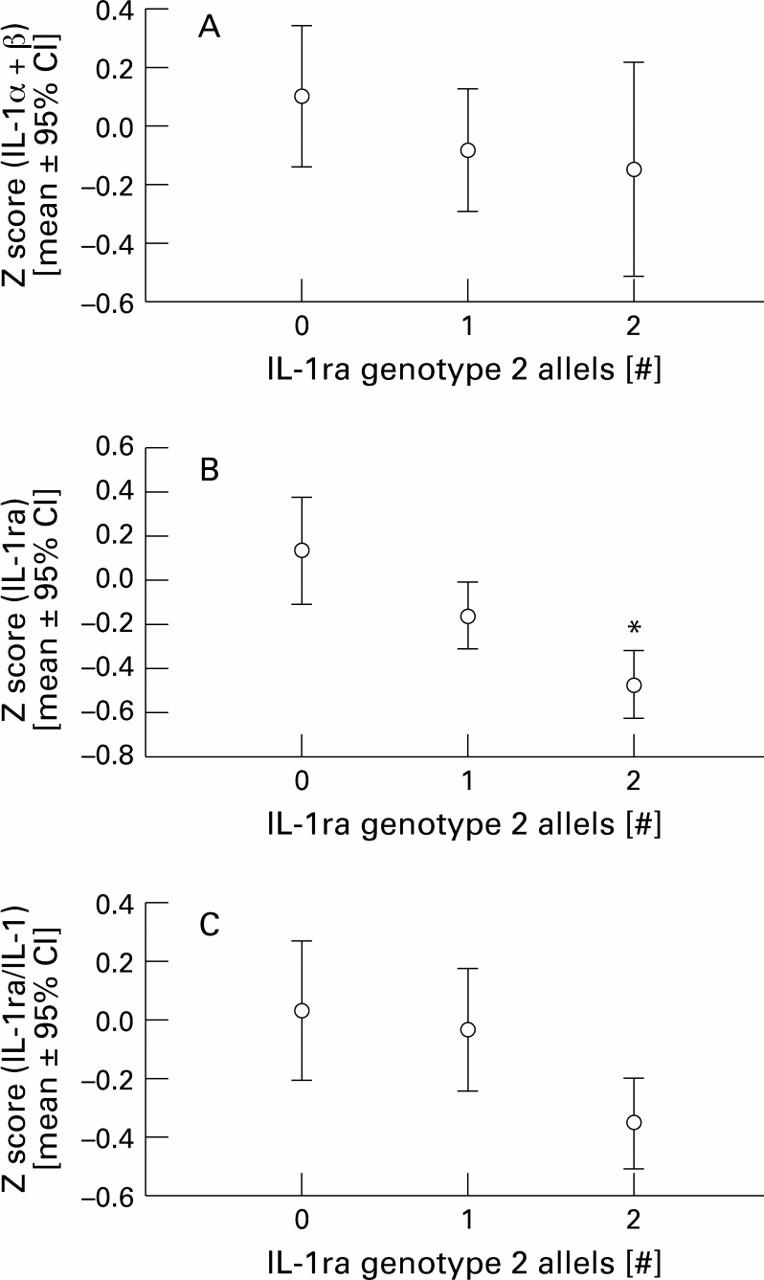
Results: IL-1 alpha and IL-1 beta were significantly increased in inflamed mucosa in inflammatory bowel disease (IBD) (CD: 53.5 (22.4) and 409.9 (118.7) pg/mg protein, respectively; UC: 18.9 (6.8) and 214.5 (78.2) pg/mg, respectively) and non-IBD patients (19.2 (7.4) and 281.4 (121.0) pg/mg, respectively; p < 0.0001) compared with normal controls (2.8 (0.6) and 30.6 (5.6) pg/mg, respectively). In CD IL-1 alpha and beta were also significantly increased in non-inflamed mucosa (6.1 (1.3) pg/mg and 88.7 (17.4) pg/mg, respectively; p < 0.0012). IL-1ra:(IL-1 alpha+beta) ratios were significantly decreased in inflamed mucosa of patients with CD (182 (45); p < 0.0001), UC (425 (136); p = 0.0018) and without IBD (221 (76); p < 0.0001), and in non-inflamed mucosa in CD (369 (149); p < 0.0001) compared with normal controls (1307 (245); p < 0.0001). Patients with IL-1ra genotype 2 had slightly but significantly reduced mucosal IL-1ra concentrations (p = 0.003). The greatest difference was seen in colonic biopsy specimens from patients with inflamed Crohn's disease.
Conclusion: Mucosal inflammation can modulate the balance of the IL-1:IL-1ra system in colonic mucosa.
Figures


References
Publication types
MeSH terms
Substances
LinkOut - more resources
Full Text Sources
Other Literature Sources