. 1998 Jan;111(1):7-37.
doi: 10.1085/jgp.111.1.7.

Kinetics of recovery of the dark-adapted salamander rod photoresponse

Affiliations

Kinetics of recovery of the dark-adapted salamander rod photoresponse

S Nikonov et al. J Gen Physiol. 1998 Jan.

Abstract

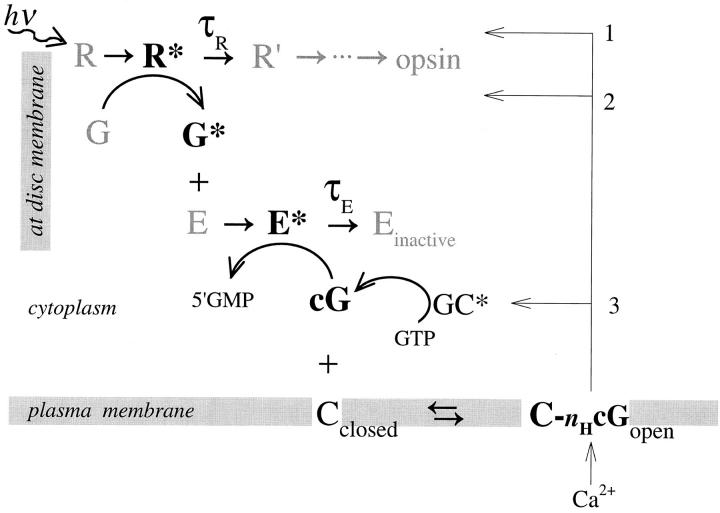
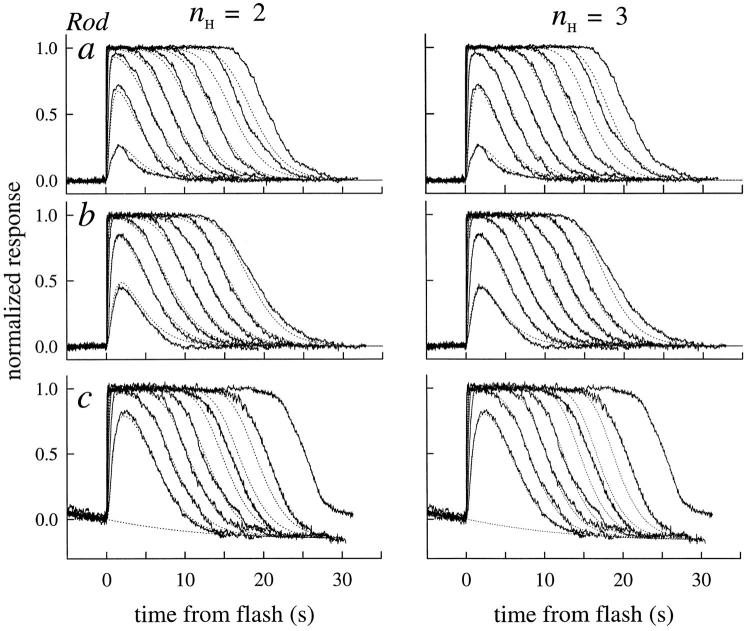
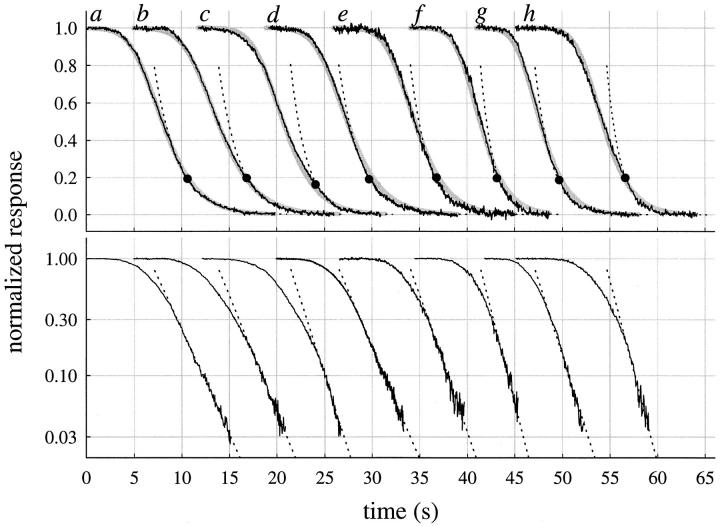
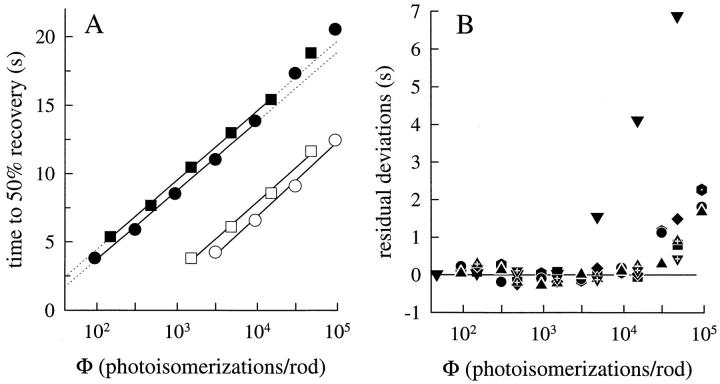
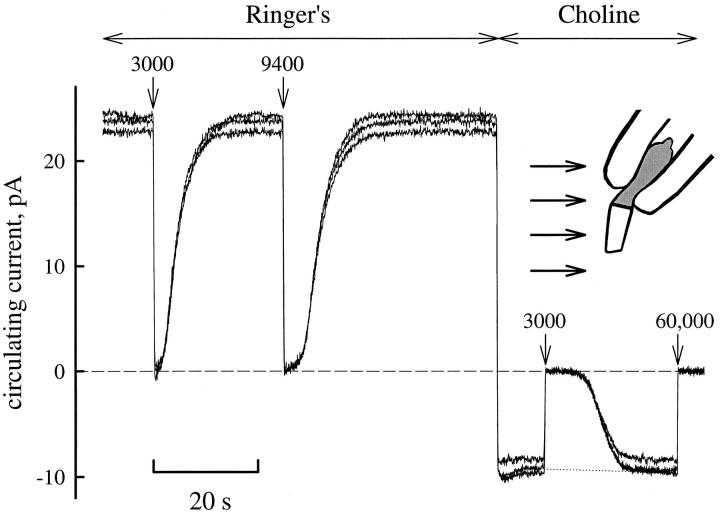
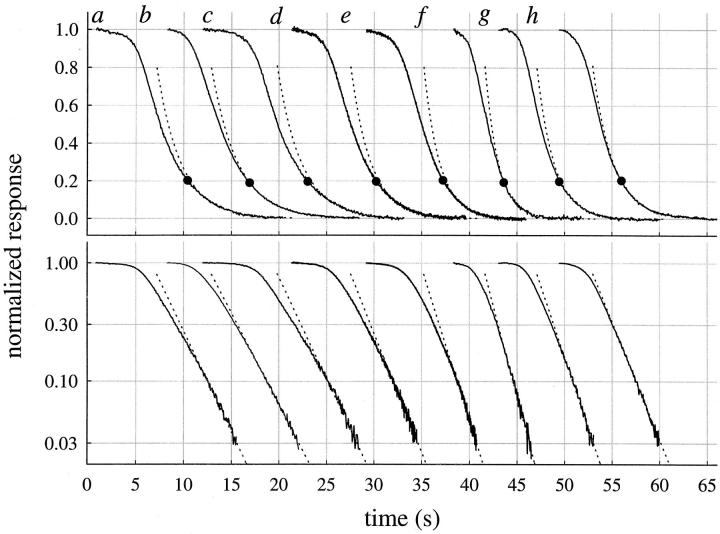
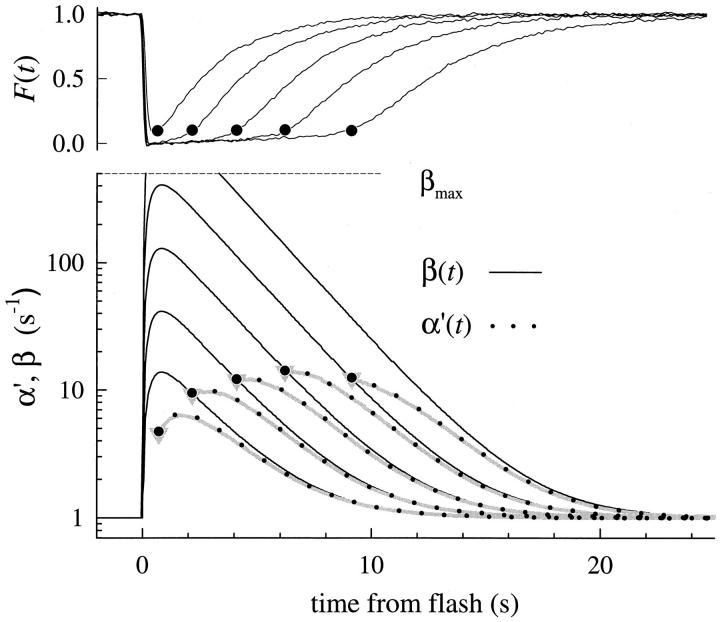
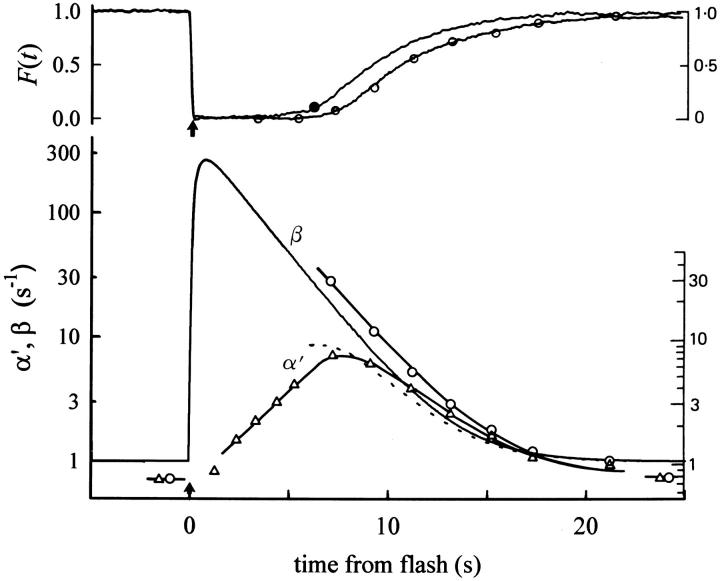
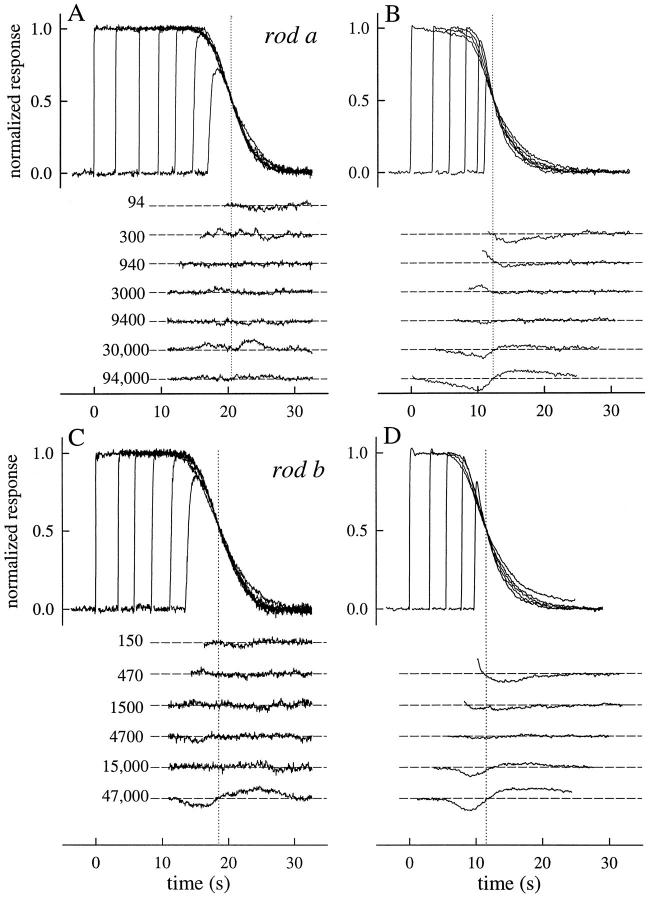
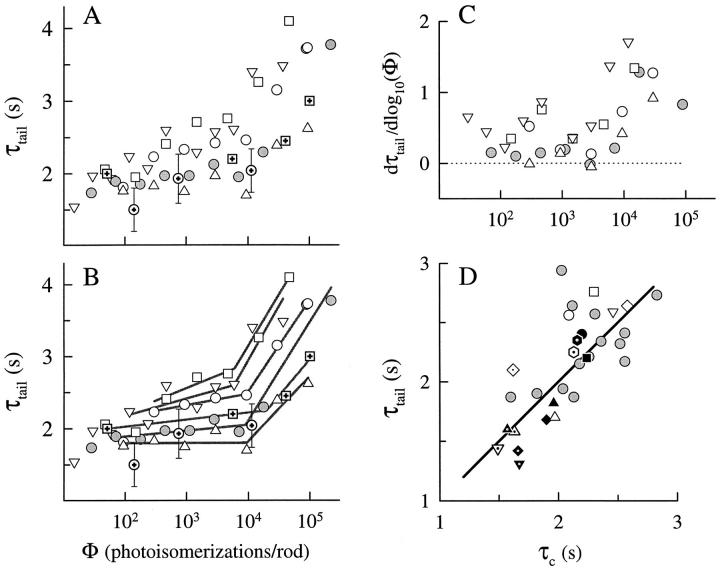
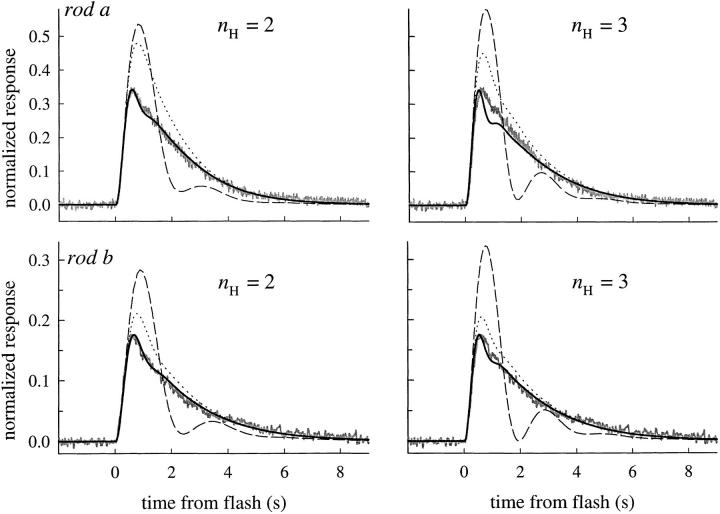
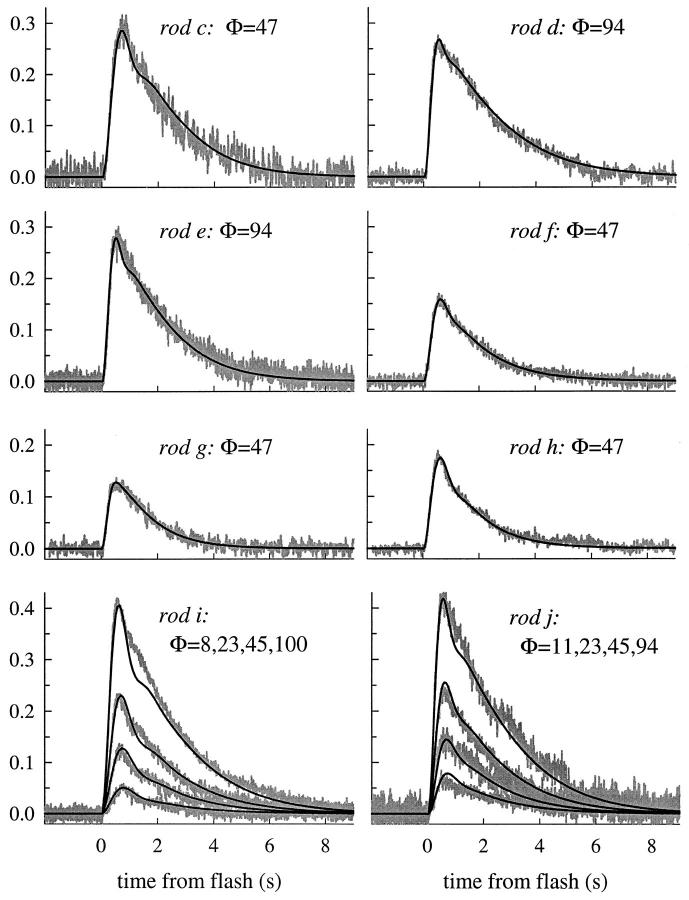
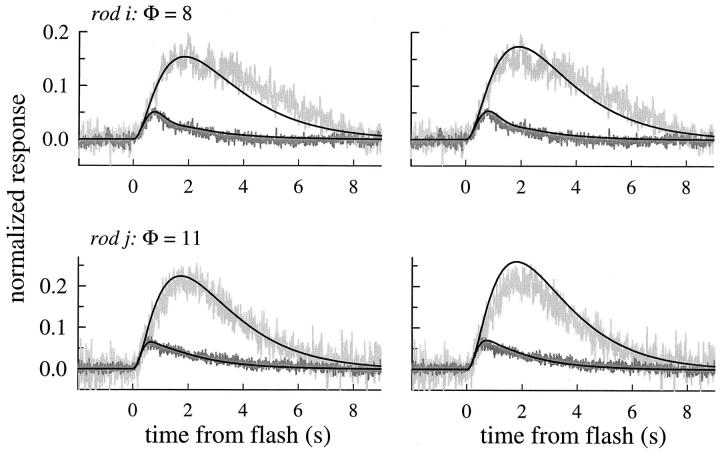
The kinetics of the dark-adapted salamander rod photocurrent response to flashes producing from 10 to 10(5) photoisomerizations (Phi) were investigated in normal Ringer's solution, and in a choline solution that clamps calcium near its resting level. For saturating intensities ranging from approximately 10(2) to 10(4) Phi, the recovery phases of the responses in choline were nearly invariant in form. Responses in Ringer's were similarly invariant for saturating intensities from approximately 10(3) to 10(4) Phi. In both solutions, recoveries to flashes in these intensity ranges translated on the time axis a constant amount (tauc) per e-fold increment in flash intensity, and exhibited exponentially decaying "tail phases" with time constant tauc. The difference in recovery half-times for responses in choline and Ringer's to the same saturating flash was 5-7 s. Above approximately 10(4) Phi, recoveries in both solutions were systematically slower, and translation invariance broke down. Theoretical analysis of the translation-invariant responses established that tauc must represent the time constant of inactivation of the disc-associated cascade intermediate (R*, G*, or PDE*) having the longest lifetime, and that the cGMP hydrolysis and cGMP-channel activation reactions are such as to conserve this time constant. Theoretical analysis also demonstrated that the 5-7-s shift in recovery half-times between responses in Ringer's and in choline is largely (4-6 s) accounted for by the calcium-dependent activation of guanylyl cyclase, with the residual (1-2 s) likely caused by an effect of calcium on an intermediate with a nondominant time constant. Analytical expressions for the dim-flash response in calcium clamp and Ringer's are derived, and it is shown that the difference in the responses under the two conditions can be accounted for quantitatively by cyclase activation. Application of these expressions yields an estimate of the calcium buffering capacity of the rod at rest of approximately 20, much lower than previous estimates.


Figures

Figure 1
Figure 1
A schematic representation of the rod transduction cascade. Table I identifies the variables and parameters. The notation is that used in previous papers (see for example Pugh and Lamb, 1993; Lyubarsky et al., 1996). The arrows at right point to sites in the cascade at which calcium is known or has been  hypothesized to affect photoresponse recoveries, based on results of biochemical and physiological experiments. These sites are (1) R* inactivation kinetics, via the calcium-binding protein recoverin; (2) R* catalytic gain; (3) guanylyl cyclase activity.
Figure 4
Figure 4
Averaged photoresponses of three rods (noisy traces) obtained under calcium clamp, fitted with a model (dotted traces) in which the disc-associated reactions are characterized as a linear cascade having two inactivation time constants (Eq. 5). The larger of the two time constants, τc, was estimated initially from analysis of the recovery half-times as in Fig. 5 A (i.e., by application of theorem 1), with small variations (∼5%) allowed to optimize the fittings. The lesser time constant τnd was estimated from the fitting; its value was strongly constrained by the time to peak of the subsaturating responses, though also affected somewhat by the value of βdark, as expected from theorem 5. The value of βdark was varied between 0.8 and 1.2 to optimize the fittings: the final values were 1.1, 0.8, and 0.8 s−1. The fittings were done with the Hill coefficient n H = 2 (left), and also with n H = 3 (right). Holding the value of n H at either 2 or 3 had negligible effect on the estimates of τnd (as expected from theorems 2–3), or on the amplification constant, A (Table II). Such invariance of A is expected from previous work (Lamb and Pugh, 1992). Rods a and b are typical in their parameter values. In contrast, rod c was unusual in being about three times more light-sensitive (without having an unusually large value of A); however, the estimate of τnd for this rod was about three times greater than the average. The “undershoot” of current after the responses of rod c was modeled by continual activation of cyclase at rate 0.017/n H s−1 (Lyubarsky et al., 1996, Eq. 12). The unusual features of the rod suggest that it may have had a higher Ca2+ i in Ringer's than the other rods.
Figure 6
Figure 6
Recovery templates and tail phase data obtained in choline of eight different rods; letter labels correspond to those used in Table II to identify the rods. (top) The noisy traces are the recovery templates of the rods obtained by averaging the responses in choline to saturating flashes up to Φ = 10,000, as illustrated in Fig. 2. The thicker gray curves lying behind the template traces are the theoretical recovery template forms generated with the model, as in Fig. 4; the parameter values characterizing these theoretical templates are reported in Table II (the value of n H used was 3). The dotted trace is a first-order exponential, fitted to the tail phase of the template data trace, beginning at the point (∼0.2) marked with a filled circle; the exponentials were fitted with the simplex fitting algorithm in the MatLab™ software package. The values of the time constants τtail for the exponentials are reported in Table II. (bottom) The data traces and fitted exponentials are replotted in semilog coordinates; the traces are truncated at a normalized amplitude of ∼0.03–0.04, corresponding to an absolute magnitude of 0.3–0.4 pA (the amplitude of saturated responses under these conditions in choline is ∼10–11 pA; see Fig. 2).
Figure 5
Figure 5
(A) Half-times of recovery for responses of rod a (circles) and rod b (squares) collected in choline (filled symbols) and in Ringer's (open symbols). Regression lines have been fitted to the choline data for flashes up to and including Φ = 10,000, and extrapolated (dotted lines); regression lines were fitted to the entire set of response half-times obtained in Ringer's. For rod a, the regression slopes (in unit of s per e-fold increase in intensity) are 2.2 and 2.3 for the Ringer's and choline data (○ and •, respectively); for rod b, the slopes are 2.1 and 2.3 (□ and ▪, respectively). The shift ΔT 0.5 between the choline and Ringer's recovery data is 7.7 s for the circles, and 7.0 s for the squares. (B) Choline recovery half-time data from eight rods for flashes up to Φ = 100,000. Linear regression lines as in the left panel were fitted to responses up to and including Φ = 10,000, and then extrapolated; the plotted points represent the residual deviations from the regression lines. All eight rods exhibit reliable deviations in the intensity range above Φ = 30,000. The downward triangles represent data of rod c.
Figure 2
Figure 2
Protocol used for measuring photoresponses in Ringer's and calcium-clamping choline solution. As illustrated in the inset at right, the inner segment of the rod is held in a suction pipette containing normal Ringer's, while the outer segment is fully exposed to a test solution, which is either Ringer's or isotonic choline containing 2.3 nM Ca2+. At the beginning of each cycle, the rod was exposed to the test flash, in this case producing Φ = 3,000 photoisomerizations; the rod was then exposed to a standard flash, Φ = 9,400, and 40 s later the outer segment was jumped into choline. At 10 s after the jump into choline, the test flash was again delivered and, after an appropriate period (which depended on the test flash intensity), given a standard saturating flash and returned to Ringer's. The junction current produced by the jump to choline has been subtracted from the raw records (see Lyubarsky et al., 1996, Fig. 1). The entire cycle was completed three times for flashes spanning the intensity range from Φ = 94 to 94,000. Over the 2.5-h time period required for the recording, the circulating current declined ∼10–15%; the photocurrent traces were normalized before averaging for additional analysis. In addition, the circulating current recovery after the initial test flash in choline increased ∼10% over the time course of recording from its magnitude at the time of the first flash, as indicated by the dashed line. Before averaging the photocurrents, a correction for this effect was applied by dividing the overall circulating current (at each time point) by the current course represented by the dashed line. (The line drawing of the rod was made from a videotape record of the experiment, obtained with infrared viewing equipment.)
Figure 9
Figure 9
(top) Recovery templates (unbroken traces) for responses in Ringer's. Here the template represents the averaged response to a flash producing either Φ = 4,700 or 9,400 (the number of responses averaged varied between 9 and 28 for different rods, depending on how many times it was possible to repeat the entire response family series). The tail phase of the template was fitted with an exponential, as in Fig. 6, from the point marked with the filled symbol. a–h correspond to labels used in Fig. 6 and in Table II. (bottom) The data and fitted exponentials of the top panel are shown in semilog format.
Figure 8
Figure 8
(top) Family of saturating responses obtained in Ringer's for rod a (see Table II); the point of 10% circulating current recovery on each trace is marked with a filled symbol. (bottom) Application of the analysis of Fig. 7 to the responses in the top panel: the unbroken traces give the estimates of β(t) obtained from the model analysis applied to the responses of the rod to the same flash series in choline (Fig. 3). The dotted curves are the predicted time courses of α′(t). The curves are only calculated for t such that F(t) ≥ 0.1, with the filled symbol marking the value of α′ associated with 10% circulating current recovery. The dotted line labeled βmax is an estimate of the highest possible rate constant of cGMP hydrolysis, computed as βmax = PDE tot βsub, where PDE tot is the total number of catalytic subunits in the outer segment (Dumke et al., 1994) and βsub is the hydrolytic rate constant of a single fully activated catalytic subunit in a well-stirred volume equal to that of the outer segment (Lamb and Pugh, 1992).
Figure 7
Figure 7
(top) This shows two photoresponses: the trace with open symbols attached is copied without alteration from Fig. 15 of Hodgkin and Nunn (1988); they obtained it as the response of a salamander rod to a flash estimated to yield Φ = 40,800. The second trace, with the filled symbol attached is from rod a (Table II) of this paper to a flash estimated to yield Φ = 30,000. The filled symbol indicates the point of 10% circulating current recovery. (bottom) Estimates of β and α′ = α/cG dark. The unbroken curves through the open symbols reproduce the estimates of the time course of these variables obtained by Hodgkin and Nunn (1988), based on the application of the IBMX jump method during the response of the rod of the top panel to the Φ = 40,800 flash at the points marked with the open circles. The unbroken trace labeled “β” gives an estimate of β(t) for the response of rod a to the Φ = 30,000 flash in the top panel; this estimate was obtained from the curve fitting analysis of Fig. 4. The dotted trace is the time course of α′(t) predicted from the relation α′(t) = β(t)F(t)(1/n H ), as described in the text. The purpose of reproducing the Hodgkin and Nunn (1988) data is to show how similar the estimates of β and α′ obtained here are to theirs. Note that we have reproduced the original figure scales of the Hodgkin and Nunn (1988) figure to the right of both panels.
Figure 3
Figure 3
Experimental results examining Recovery Translation Invariance for two rods. A and B show photoresponses collected from the rod of Fig. 2 (rod a); C and D show photoresponses collected from a second (rod b). In the upper part of each panel, the responses are shown translated on the time axis to coincide with the point of 50% recovery, which is indicated by a dotted vertical line; in the lower part of each panel a template recovery shape has been subtracted from each trace; the template was made by averaging the three responses in the midrange of intensities (940– 9,400) that have the most closely identical shapes. For rod a, the template curve was essentially identical to the responses to the flash Φ = 9,400; for rod b, the template curve was most closely similar to the responses to the flash Φ = 4,700. The responses of rod a are the averages of three individual responses to each intensity; those of the rod b to two flashes. The flashes delivered to rod a were 20 ms in duration; those to rod b were 10 ms. Full obedience to RTI (Eq. 1) requires not only that the recovery shapes be identical, but also that the spacing between the activation phases in the upper part of each panel be uniform.
Figure 10
Figure 10
(A) Estimates of τtail obtained from responses in Ringer's are plotted as a function of flash intensity, Φ; the responses fitted were the averages of three to five responses obtained over the time course of an experiment. Data of different rods are represented by different symbols. The symbols with embedded crosses replot estimates of the first-order time constant of decay of Δβ obtained by Hodgkin and Nunn (1988). (B) Data in A are shown again, but with straight lines fitted to points lying between Φ ≈ 100 and 10,000, and to the points above Φ ≈ 10,000, as described in the text. (C) Local slopes of the empirical functions in A, computed by fitting a parabola by least-squares successively to each triplet of data points, and taking the derivative of the parabola at the center point of the triplet as the estimate of the slope. The slopes above Φ ≈ 10,000 lie reliably above those below this intensity. (D) τtail for each rod plotted against τc (obtained as in Fig. 5 A). Open symbols refer to estimates obtained for responses in Ringer's, filled symbols for responses obtained in choline; different symbols refer to different rods. Ringer's data (gray symbols) from a number of additional rods are included.
Figure 11
Figure 11
Responses in Ringer's (noisy gray traces) of rods a (Φ = 94) and b (Φ = 47), along with theoretical curves. The thicker black theoretical traces were generated by numerically solving the ensemble of Eqs. 5, 6, 9, and 11–13, with the parameter values reported in Tables III and IV; the estimates of the resting calcium buffering capacity were fixed at B Ca = B Ca,rest = 15 and 18, for rods a and b, respectively. The dashed theoretical traces were generated by solving the same set of equations, but Eq. 18 was also added, with C buff = 100 μM and K buff = 0.7 μM; this corresponds to B Ca,rest ≈ 75. The dotted theoretical traces were computed with the analytical model of the change in cGMP (Eq. A6.10), produced by linearizing Eqs. 9, and 11–13, as explained in iin association with the proof of theorem 6. The cGMP-channel activation reaction, Eq. 5 was not linearized. For all theory traces in the left-hand panels, n H, the Hill coefficient of the cGMP channels was 2, for the right-hand panels, 3.
Figure 12
Figure 12
Theoretical traces generated by fitting numerical solutions of Eqs. 5, 6, 9, and 11–13, to the responses in Ringer's of rods c–h to the dimmest flash used to stimulate each rod, and to four responses of each of two other rods (i and j) stimulated with a series of low intensity flashes. The ordinate is the normalized response amplitude, as in Fig. 11. The traces were filtered at 25 Hz. The noisiness of the traces corresponds roughly with the numbers of individual responses averaged, which were as follows: c (n = 1); d (n = 2); e (n = 3); f (n = 2); g (n = 2); h (n = 5); i (n = 5, 4, 4, 4, respectively, from least to most intense); j (n = 2, 2, 3, 2, respectively). The plots give the flash intensities used in the model calculations; for rod i, the intensity values 8 and 100 were substituted for the nominal values 11 and 94, respectively, in the calculations. The parameters of the fitted traces are given in Tables III and IV; for all theoretical traces in this figure n H = 2.
Figure 13
Figure 13
Responses of rods i and j to the lowest intensity flashes used to stimulate each rod in Ringer's and in choline, compared with theoretical traces. The noisy darker gray traces are the responses in Ringer's; the lighter gray traces are the responses in choline. The choline traces were scaled to correspond to the Ringer's traces during the activation phase; the responses so plotted are governed by the same amplification constant, A. (The choline traces are noisier in part because of the scaling, in part because the unscaled amplitudes were smaller, and in part because they represent averages of fewer traces.) The “calcium-clamp” responses of both rods were obtained in 0-Ca2+ choline (see Table II), and had slowly increasing baselines, as illustrated in Fig. 4, rod c. Correction for the baseline was made by computing F(t) = J(t)/J dark(t), where J dark(t) is the baseline current in the dark recorded after a jump into choline over a period equal to that of the response, and J(t) is the current trace recorded when the flash is delivered. For the two panels at left, the theory traces were computed as in Fig. 12 for fittings to the Ringer's responses, and by numerically solving Eqs. 5, 6, and 9 for fitting the responses in choline; the solutions to the latter equations were generated with the same method used to fit calcium-clamp responses by Lyubarsky et al. (1996). For the two panels at right, the analytical solutions for ΔcG(t) = cG(t) − cG dark were used (i, theorems 4 and 6). At the peak of the ΔcG(t) response, the values were not sufficiently small for the perturbation expansion of the Hill relation (Eq. A4.3) to be accurate. Thus, rather than use Eqs. 19 and 20 to generate the curves in this figure, the appropriate Hill relation was applied to cG(t)/cG dark. The Hill coefficient was n H = 2 for all theory traces; other parameter values are given in Table IV.

Similar articles

Cited by

References

    1. Aczel, J. 1966. Lectures on functional equations and their applications. Academic Press, New York.
    1. Adelson EH. The delayed rod afterimage. Vision Res. 1982a;22:1313–1328. - PubMed
    1. Adelson EH. Saturation and adaptation in the rod system. Vision Res. 1982b;22:1299–1312. - PubMed
    1. Angleson JK, Wensel TG. Enhancement of rod outer segment GTPase accelerating protein activity by the inhibitory subunit of GMP phosphodiesterase. J Biol Chem. 1994;269:16290–16296. - PubMed
    1. Arshavsky VY, Gray-Keller MP, Bownds MD. cGMP suppresses GTPase activity of portion of transducin equimolar to phosphodiesterase in frog rod outer segments. Light-induced cGMP decreases as a putative feedback mechanism of the photoresponse. J Biol Chem. 1991;266:18530–18537. - PubMed

Publication types

MeSH terms