. 1998 Jan;111(1):39-51.
doi: 10.1085/jgp.111.1.39.

Onset of feedback reactions underlying vertebrate rod photoreceptor light adaptation

Affiliations

Onset of feedback reactions underlying vertebrate rod photoreceptor light adaptation

P D Calvert et al. J Gen Physiol. 1998 Jan.

Abstract

Light adaptation in vertebrate photoreceptors is thought to be mediated through a number of biochemical feedback reactions that reduce the sensitivity of the photoreceptor and accelerate the kinetics of the photoresponse. Ca2+ plays a major role in this process by regulating several components of the phototransduction cascade. Guanylate cyclase and rhodopsin kinase are suggested to be the major sites regulated by Ca2+. Recently, it was proposed that cGMP may be another messenger of light adaptation since it is able to regulate the rate of transducin GTPase and thus the lifetime of activated cGMP phosphodiesterase. Here we report measurements of the rates at which the changes in Ca2+ and cGMP are followed by the changes in the rates of corresponding enzymatic reactions in frog rod outer segments. Our data indicate that there is a temporal hierarchy among reactions that underlie light adaptation. Guanylate cyclase activity and rhodopsin phosphorylation respond to changes in Ca2+ very rapidly, on a subsecond time scale. This enables them to accelerate the falling phase of the flash response and to modulate flash sensitivity during continuous illumination. To the contrary, the acceleration of transducin GTPase, even after significant reduction in cGMP, occurs over several tens of seconds. It is substantially delayed by the slow dissociation of cGMP from the noncatalytic sites for cGMP binding located on cGMP phosphodiesterase. Therefore, cGMP-dependent regulation of transducin GTPase is likely to occur only during prolonged bright illumination.


Figures

Figure 1
Figure 1
Ca2+ dependence of frog ROS guanylate cyclase activity. The cyclase reaction was initiated by adding 10 μl of pseudointracellular medium containing 2 mM [γ-33P]GTP, 20 μM ATP, 20 mM [3H]-cGMP, and Ca2+ buffered to indicated concentration to 10 μl of a ROS suspension containing 40 μM rhodopsin and 200 μM zaprinast buffered to the same Ca2+. After 30 s, the reaction was stopped with the addition of 80 μl of a quench solution containing 50 mM EDTA, pH 7.0. The cyclase activity is expressed as μM cGMP produced in the equivalent ROS cytoplasm per second and is plotted against the free Ca2+ concentration. Each point represents the mean ± SD of four separate determinations. The solid line is a fit of Eq. 1 to the data with αmax = 9.74, αmin = 1.88, K 1/2 = 256 nM Ca2+, and n = 1.82. (inset) A similar experiment carried out at 180 μM rhodopsin. Here, fitting Eq. 1 to the data gave αmax = 12.7, αmin = 1.8, K 1/2 = 230 nM Ca2+, and n = 1.85.
Figure 2
Figure 2
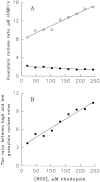
The extent of Ca2+-dependent regulation of guanylate cyclase activity in frog ROS increases with the increase in ROS concentration. (A) The cyclase activity in ROS suspensions containing indicated amounts of rhodopsin was measured at 13 nM (○) and 13 μM (•) Ca2+ as described for Fig. 1, except that 1 mM GTP was used and the incubation time was 20 s. The lines represent linear regression drawn through the points. (B) The ratios of values obtained in A for low and high Ca2+ are plotted as a function of ROS concentration. The line is a linear regression drawn through the points. All data are taken from one of three identical experiments.
Figure 3
Figure 3
Guanylate cyclase activity quickly changes after a rapid change in free Ca2+. (A) The transition from slow to fast cyclase rate. The time course of cGMP synthesis in ROS suspensions containing 20 μM rhodopsin was measured with 10 μM Ca2+ (•), 10 nM Ca2+ (○), and after a step from 10 μM to 10 nM Ca2+ (♦). The cyclase reaction was initiated with the addition of 10 μl pseudointracellular medium containing 400 μM [α- 33P]GTP and 20 mM cGMP to 10 μl of ROS suspensions containing 40 μM rhodopsin and 200 μM zaprinast. At indicated times, the reaction was quenched with 80 μl of 50 mM EDTA, pH 7.0. The data are plotted as the millimoles cGMP produced per mole of rhodopsin versus time. The solid lines through the closed and open circles are straight lines originating from zero, providing cyclase rates of 0.72 and 4.92 μM/s, respectively. The solid line through the diamonds is a fitting of Eq. 2 to the data where αmin = 0.72 μM/s, αmax = 4.68 μM/s, and τ = 200 ms. The dashed line, provided for comparison, was generated using Eq. 2 setting αmin = 0.72 μM/s, αmax = 4.68 μM/s, and τ = 1 s. The figure is representative of three similar experiments. (B) The transition from fast to slow cyclase rate. An experiment analogous to that shown in A was performed to estimate the rate of transition of the cyclase rate at 100 nM Ca2+ to that at 500 nM Ca2+. The time course of the cGMP production in ROS suspensions containing 20 μM rhodopsin was measured under three different conditions: (a) ROS contained 500 nM Ca2+ and stayed at 500 nM Ca2+ throughout the experiment (○); (b) ROS contained 100 nM Ca2+ and stayed at 100 nM Ca2+ throughout the experiment (•); and (c) ROS were incubated at 100 nM Ca2+ before the experiment, and then Ca2+ was increased to 500 nM at time zero (♦). The lines through the filled and open circles are straight lines originating from zero, providing cyclase rates of 4.3 and 2.0 μM/s, respectively. The data for the transition condition are fit with Eq 3:formula image where α500 is the cyclase rate at 500 nM Ca2+ and α100 is the cyclase rate at 100 nM Ca2+. This analysis yielded a τ indistinguishable from zero. The figure shows one of two similar experiments.
Figure 4
Figure 4
Rhodopsin kinase activity quickly increases after a rapid reduction in free Ca2+. The time course of rhodopsin phosphorylation in ROS supplemented with 30 μM myristoylated recombinant recoverin was measured under three different conditions: (a) ROS contained high 10-μM Ca2+ and stayed at this Ca2+ throughout the experiment (•); (b) ROS contained 10-nM Ca2+ and stayed at this Ca2+ throughout the experiment (○); (c) ROS were incubated at 10 μM Ca2+ before the initiation of the reaction, and then Ca2+ was reduced to 10 nM at time zero (♦). The phosphorylation reaction was initiated when 10 μl of pseudointracellular medium containing 50 μM [γ-32P]ATP was added to 10 μl of ROS suspension containing 100 μM rhodopsin and 60 μM myristoylated recoverin. Just before initiating the reaction, ROS suspensions were exposed to bright white light for 30 s to fully bleach the rhodopsin. The reaction was quenched with the addition of 80 μl 50-mM EDTA containing 100 mM KF and 100 mM phosphate buffer, pH 7.5. The data are plotted as millimoles Pi incorporated into rhodopsin per mole rhodopsin versus time. The solid lines through the closed and open circles are straight lines originating from zero, providing rhodopsin phosphorylation rates of 1.46 and 3.94 mmol Pi/mol rhodopsin per second, respectively. The solid line through the diamonds is provided by an analysis similar to that performed in Fig. 3. The minimal phosphorylation rate (analogous to αmin in Fig. 3) was 1.46 mmol Pi/mol rhodopsin per second, the maximal phosphorylation rate was 3.94 mmol Pi/mol rhodopsin per second and τ was 110 ms. The dashed line was generated by setting the minimal phosphorylation rate to 1.46 mmol Pi/mol rhodopsin per second, the maximal phosphorylation rate to 3.94 mmol Pi/mol rhodopsin per second and τ to 1 s. The figure is representative of three similar experiments.
Figure 5
Figure 5
cGMP dissociation from the PDE noncatalytic sites after chase with CaM/CaM-PDE (A) or excess cGMP (B). Suspensions of frog ROS (30 μM rhodopsin) were preincubated for 1 min in pseudointracellular medium containing 50 μM Ca2+ and 3 μM [3H]cGMP, and then [3H]cGMP dissociation from the PDE noncatalytic sites was initiated at time zero by a chase with either CaM/CaM-PDE (80 activity units CaM per unit CaM-PDE) or 2 mM nonlabeled cGMP. The amounts of [3H]cGMP bound to PDE were determined as described in methods. CaM-PDE concentrations (U/liter): •, none; □, 7.5; ▪, 37; ▴, 150; ○, 740. The data from two lower curves of A and the curve in B are single exponential fits. The rest of the curves are hand drawn. The figure is representative of three similar experiments.
Figure 6
Figure 6
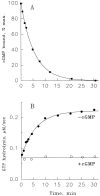
Correlation between cGMP dissociation from the PDE noncatalytic sites (A) and the transition between slow and fast transducin GTPase (B). 600 μl of a ROS suspension containing 30 μM rhodopsin was incubated for 1 min with 3 μM [3H]cGMP, and then a CaM/CaM-PDE mixture (16,000 U/liter CaM, 200 U/liter CaM-PDE) was added at time zero. The amounts of cGMP bound to PDE (A) were determined in 15-μl aliquots of the reaction mixture and the rates of transducin GTPase (B) were determined in 20-μl aliquots at indicated times as described in methods. GTPase activity was monitored either with the addition of 4 μM [γ-32P]GTP alone (•) or with a mixture of 4 μM [γ-32P]GTP and 1 mM cGMP (○). The rate constant for cGMP dissociation, determined by fitting a single exponential to the data, was 0.0029 s−1. The rate constant for the GTPase transition from slow to fast was also determined by a fit of the data to a single exponential process and found to be 0.0027 s−1. The GTPase rate when cGMP was added with the GTP was constant (lower curve in B) and was fit with a horizontal line. The figure is representative of four similar experiments.
Figure 7
Figure 7
Time window for the onset of fast transducin GTPase after bright illumination. Suspensions of bleached ROS (30 μM rhodopsin) were preincubated for 1 min with 3 μM [3H]cGMP. cGMP dissociation from the PDE noncatalytic sites was initiated at time zero by a chase with CaM/CaM-PDE (80,000 U/liter CaM, 1,000 U/liter CaM-PDE) alone (▿), CaM/CaM-PDE with 20 μM GTPγS (○), or with 20 μM GTPγS alone (•). The amounts of [3H]cGMP bound to PDE were determined as described previously. A single exponential process was fit to the data for nonactivated PDE yielding a rate constant of 0.0033 s−1. The data for the dissociation of cGMP from activated PDE with and without the CaM/CaM-PDE chase were each approximated with the sum of two exponential processes. In the case where CaM/CaM-PDE was included in the chase, cGMP dissociated from 33% of the sites with a rate constant of 0.170 s−1 and from 67% of the sites with a rate constant of 0.0082. In the case where the chase was initiated with GTPγS alone, cGMP dissociated from 33% of the sites with a rate constant of 0.095 s−1 and from 67% of the sites with a rate constant of 0.0058 s−1. The figure is representative of three similar experiments.
Figure 8
Figure 8
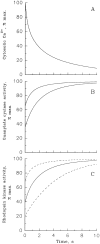
Predicted onset of Ca2+-dependent feedback reactions after bright illumination of frog photoreceptors. The time course of Ca2+ decline and the predicted increases in guanylate cyclase and rhodopsin kinase activities in rod photoreceptors after exposure to bright illumination is shown. (A) Change in free Ca2+ after saturating light. The curve was calculated from the sum of three exponential processes (McCarthy et al., 1996): Ca2+(t) = 25e−t/ 0.25 + 35e−t/ 1.35 + 40e−t/ 6.75. (B) The onset of the cyclase activity. Cyclase activity was calculated by the numerical solution of this equation and Eq. 1 in the text using the computer program Mathcad (version 6.0; MathSoft, Inc., Cambridge, MA). A 0.2-s delay was imposed between the Ca2+ decline and the change in the cyclase rate. The upper curve was calculated assuming a dark Ca2+ level of 200 nM and the lower curve with a dark Ca2+ of 400 nM. (C) Onset of rhodopsin kinase activity. In this case, the delay of 0.11 s found in Fig. 4 was imposed. The Ca2+ dependence of the kinase activity was taken from calculations in Klenchin et al. (1995). The solid line assumes a Ca2+ K 1/2 for kinase regulation of 270 nM. The dashed lines above and below the solid line assume Ca2+ K 1/2 values of 540 and 135 nM, respectively.

Similar articles

Cited by

References

    1. Ames JB, Porumb T, Tanaka T, Ikura M, Stryer L. Amino-terminal myristoylation induces cooperative calcium binding to recoverin. J Biol Chem. 1995;270:4526–4533. - PubMed
    1. Aparicio JG, Applebury ML. The photoreceptor guanylate cyclase is an autophosphorylating protein kinase. J Biol Chem. 1996;271:27083–27089. - PubMed
    1. Arshavsky VY, Bownds MD. Regulation of deactivation of photoreceptor G protein by its target enzyme and cGMP. Nature. 1992;357:416–417. - PMC - PubMed
    1. Arshavsky VY, Dumke CL, Bownds MD. Non-catalytic cGMP binding sites of amphibian rod cGMP phosphodiesterase control interaction with its inhibitory gamma-subunits—a putative regulatory mechanism of the rod photoresponse. J Biol Chem. 1992;267:24501–24507. - PubMed
    1. Arshavsky VY, Gray-Keller MP, Bownds MD. cGMP suppresses GTPase activity of a portion of transducin equimolar to phosphodiesterase in frog rod outer segments. Light-induced cGMP decreases as a putative feedback mechanism of the photoresponse. J Biol Chem. 1991;266:18530–18537. - PubMed

Publication types

MeSH terms