

Bleached pigment produces a maintained decrease in outer segment Ca2+ in salamander rods
- PMID: 9417134
- PMCID: PMC1887770
- DOI: 10.1085/jgp.111.1.53
Bleached pigment produces a maintained decrease in outer segment Ca2+ in salamander rods
Abstract
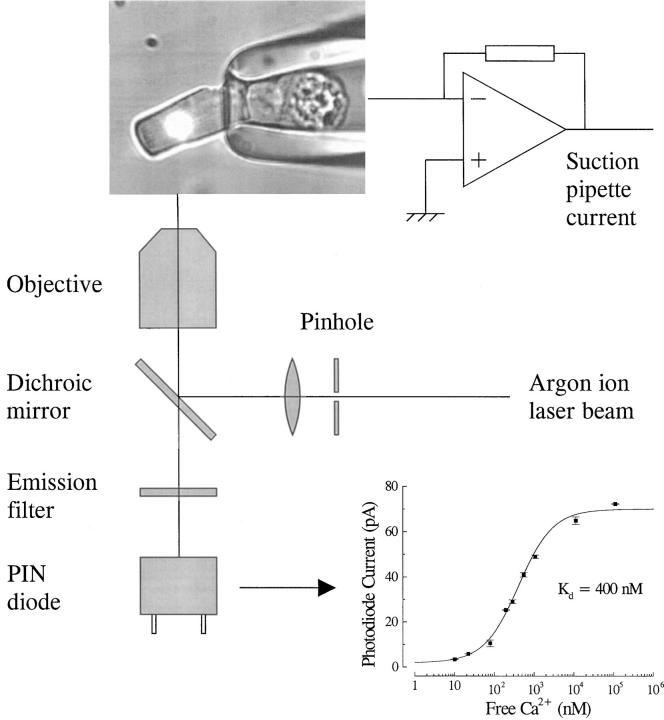
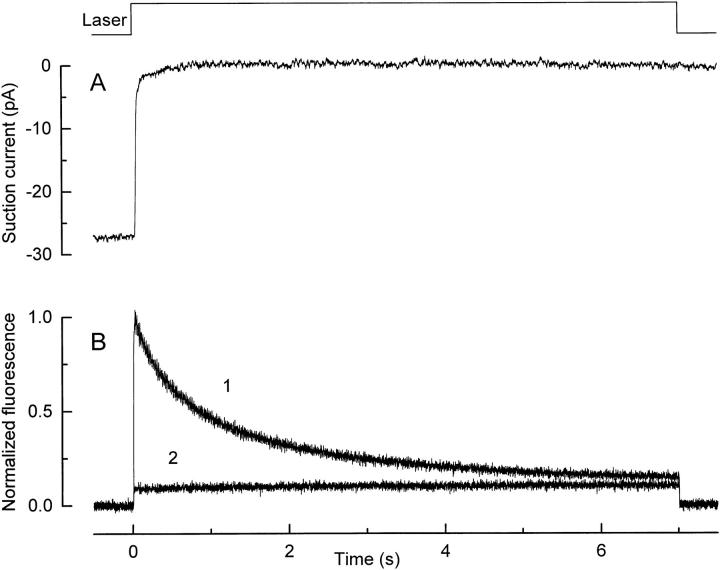
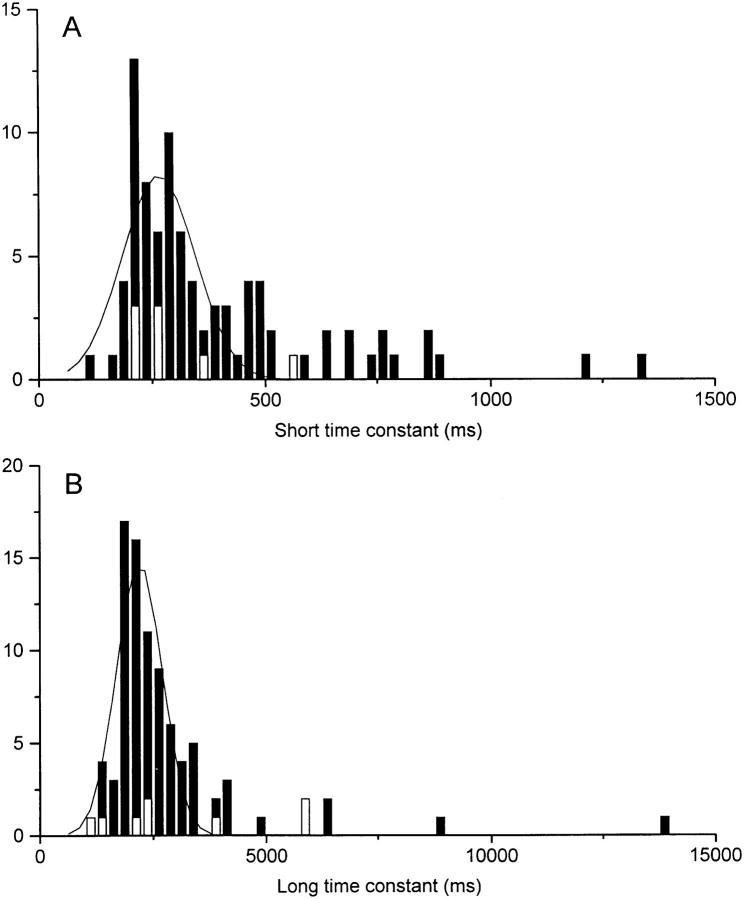
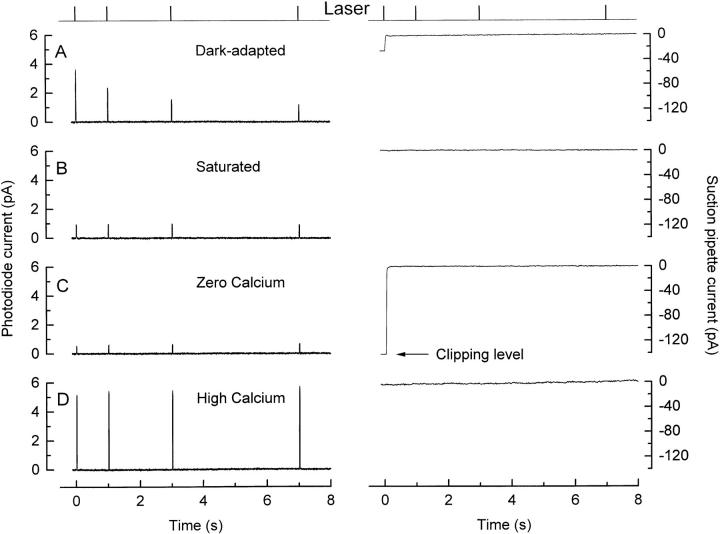
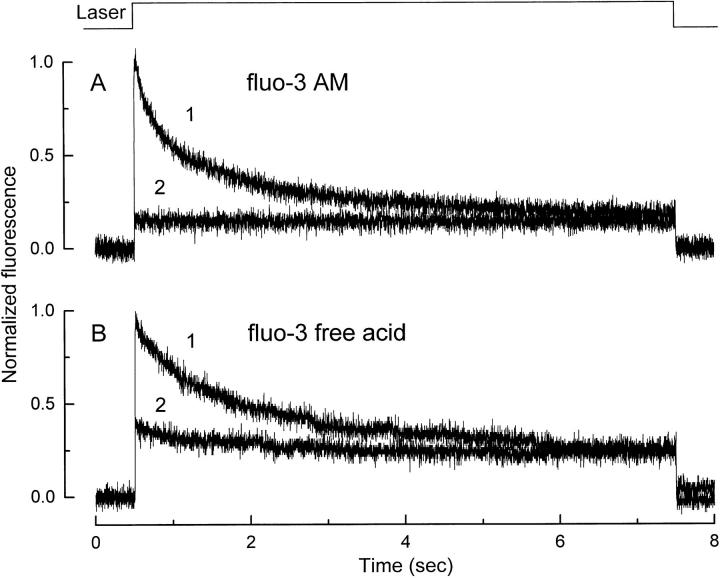
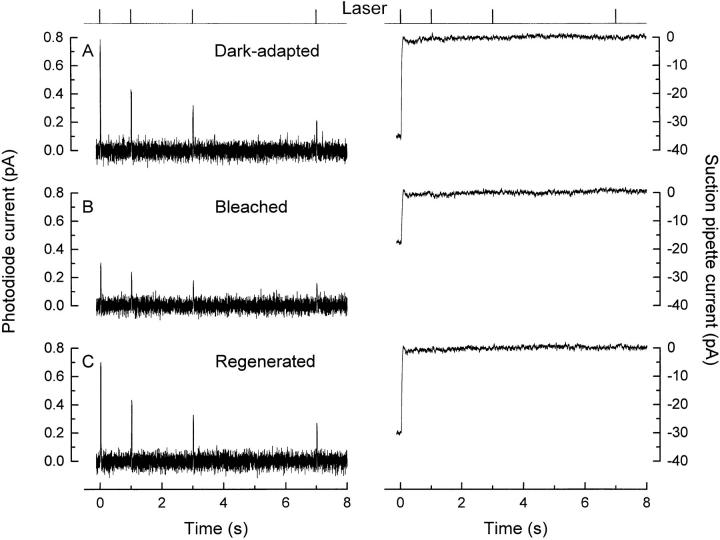
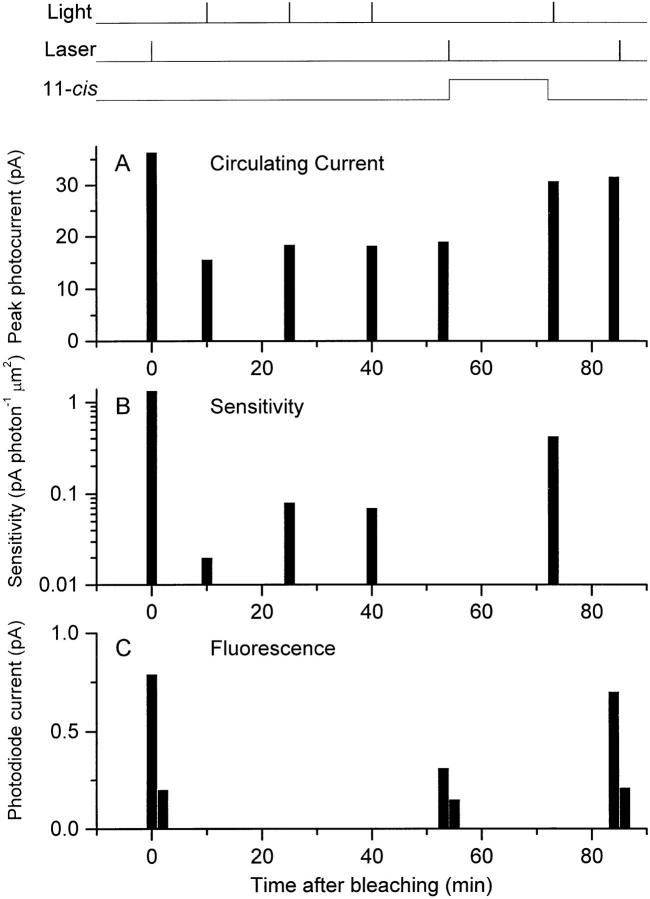
A spot confocal microscope based on an argon ion laser was used to make measurements of cytoplasmic calcium concentration (Ca2+i) from the outer segment of an isolated rod loaded with the fluorescent calcium indicator fluo-3 during simultaneous suction pipette recording of the photoresponse. The decline in fluo-3 fluorescence from a rod exposed to saturating illumination was best fitted by two exponentials of approximately equal amplitude with time constants of 260 and 2,200 ms. Calibration of fluo-3 fluorescence in situ yielded Ca2+i estimates of 670 +/- 250 nM in a dark-adapted rod and 30 +/- 10 nM during response saturation after exposure to bright light (mean +/- SD). The resting level of Ca2+i was significantly reduced after bleaching by the laser spot, peak fluo-3 fluorescence falling to 56 +/- 5% (SEM, n = 9) of its value in the dark-adapted rod. Regeneration of the photopigment with exogenous 11-cis-retinal restored peak fluo-3 fluorescence to a value not significantly different from that originally measured in darkness, indicating restoration of the dark-adapted level of Ca2+i. These results are consistent with the notion that sustained activation of the transduction cascade by bleached pigment produces a sustained decrease in rod outer segment Ca2+i, which may be responsible for the bleach-induced adaptation of the kinetics and sensitivity of the photoresponse.
Figures
Similar articles
-
A light-dependent increase in free Ca2+ concentration in the salamander rod outer segment.J Physiol. 2001 Apr 15;532(Pt 2):305-21. doi: 10.1111/j.1469-7793.2001.0305f.x. J Physiol. 2001. PMID: 11306652 Free PMC article.
-
Light-dependent changes in outer segment free-Ca2+ concentration in salamander cone photoreceptors.J Gen Physiol. 1999 Feb;113(2):267-77. doi: 10.1085/jgp.113.2.267. J Gen Physiol. 1999. PMID: 9925824 Free PMC article.
-
The effect of light on outer segment calcium in salamander rods.J Physiol. 2003 Nov 1;552(Pt 3):763-76. doi: 10.1113/jphysiol.2003.050724. Epub 2003 Aug 29. J Physiol. 2003. PMID: 12949220 Free PMC article.
-
Tuning outer segment Ca2+ homeostasis to phototransduction in rods and cones.Adv Exp Med Biol. 2002;514:179-203. doi: 10.1007/978-1-4615-0121-3_11. Adv Exp Med Biol. 2002. PMID: 12596922 Review.
-
Adaptation in vertebrate photoreceptors.Physiol Rev. 2001 Jan;81(1):117-151. doi: 10.1152/physrev.2001.81.1.117. Physiol Rev. 2001. PMID: 11152756 Review.
Cited by
-
Cloning and characterization of a potassium-dependent sodium/calcium exchanger in Drosophila.J Cell Biol. 1999 Nov 1;147(3):659-70. doi: 10.1083/jcb.147.3.659. J Cell Biol. 1999. PMID: 10545508 Free PMC article.
-
The Binding Properties and Physiological Functions of Recoverin.Front Mol Neurosci. 2018 Dec 20;11:473. doi: 10.3389/fnmol.2018.00473. eCollection 2018. Front Mol Neurosci. 2018. PMID: 30618620 Free PMC article. Review.
-
A light-dependent increase in free Ca2+ concentration in the salamander rod outer segment.J Physiol. 2001 Apr 15;532(Pt 2):305-21. doi: 10.1111/j.1469-7793.2001.0305f.x. J Physiol. 2001. PMID: 11306652 Free PMC article.
-
Diffusion of the second messengers in the cytoplasm acts as a variability suppressor of the single photon response in vertebrate phototransduction.Biophys J. 2008 May 1;94(9):3363-83. doi: 10.1529/biophysj.107.114058. Biophys J. 2008. PMID: 18400950 Free PMC article.
-
Simultaneous recording of receptor current and intraciliary Ca2+ concentration in salamander olfactory receptor cells.J Physiol. 2001 Sep 15;535(Pt 3):637-45. doi: 10.1111/j.1469-7793.2001.00637.x. J Physiol. 2001. PMID: 11559763 Free PMC article.
References
-
- Cervetto L, Lagnado L, Perry RJ, Robinson DW, McNaughton PA. Extrusion of calcium from rod outer segments is driven by both sodium and potassium gradients. Nature. 1989;337:740–743. - PubMed
