Comparative Study
. 1998 Jan;111(1):83-93.
doi: 10.1085/jgp.111.1.83.

Slow inactivation does not affect movement of the fast inactivation gate in voltage-gated Na+ channels

Affiliations
Comparative Study

Slow inactivation does not affect movement of the fast inactivation gate in voltage-gated Na+ channels

V Vedantham et al. J Gen Physiol. 1998 Jan.

Abstract

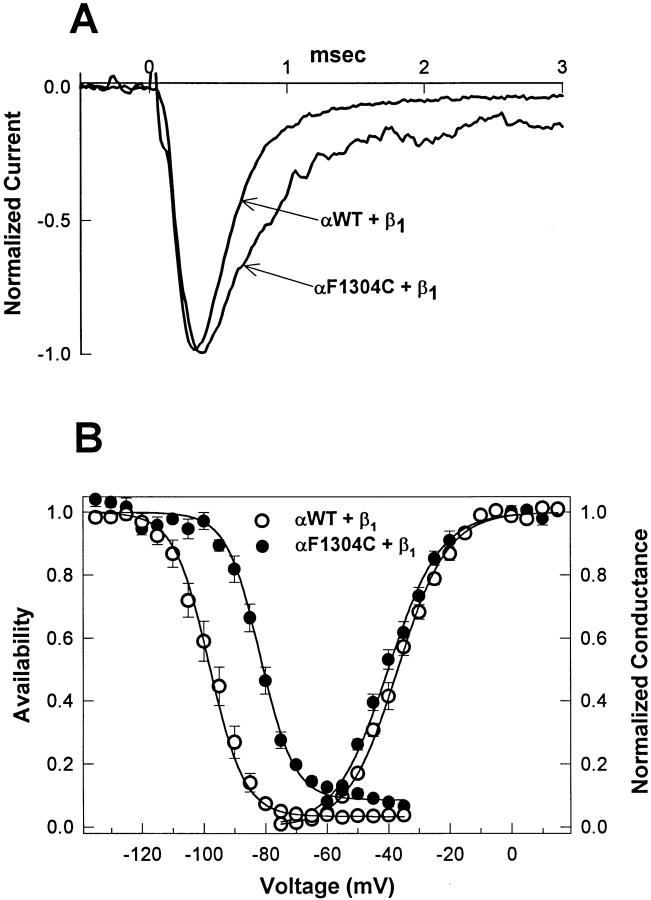
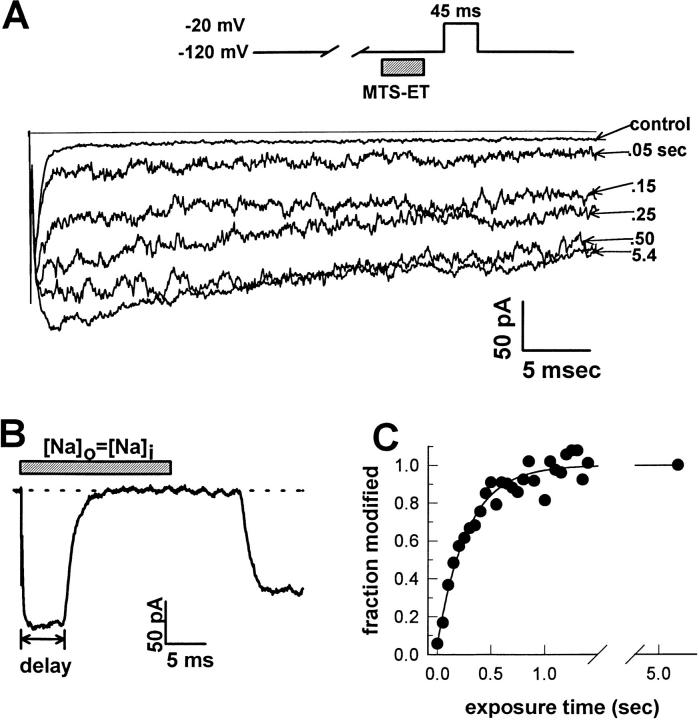
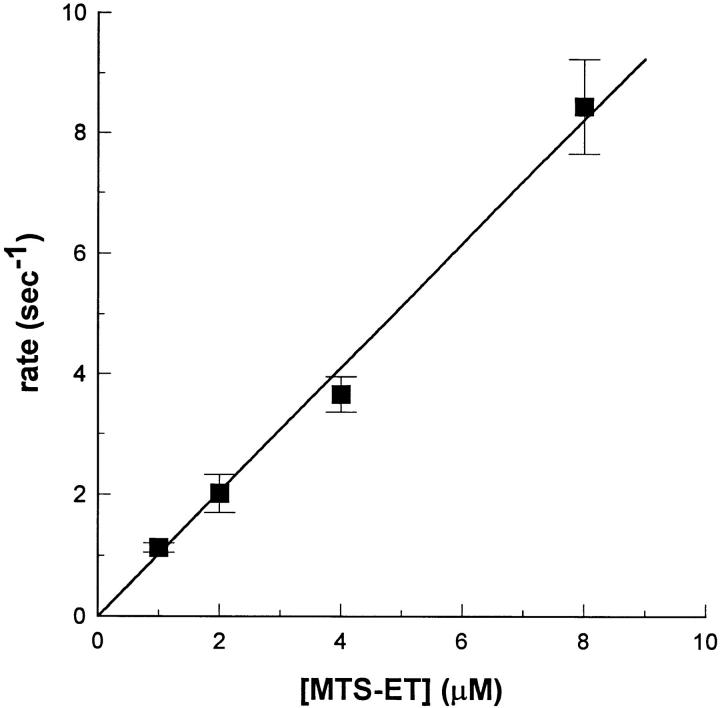
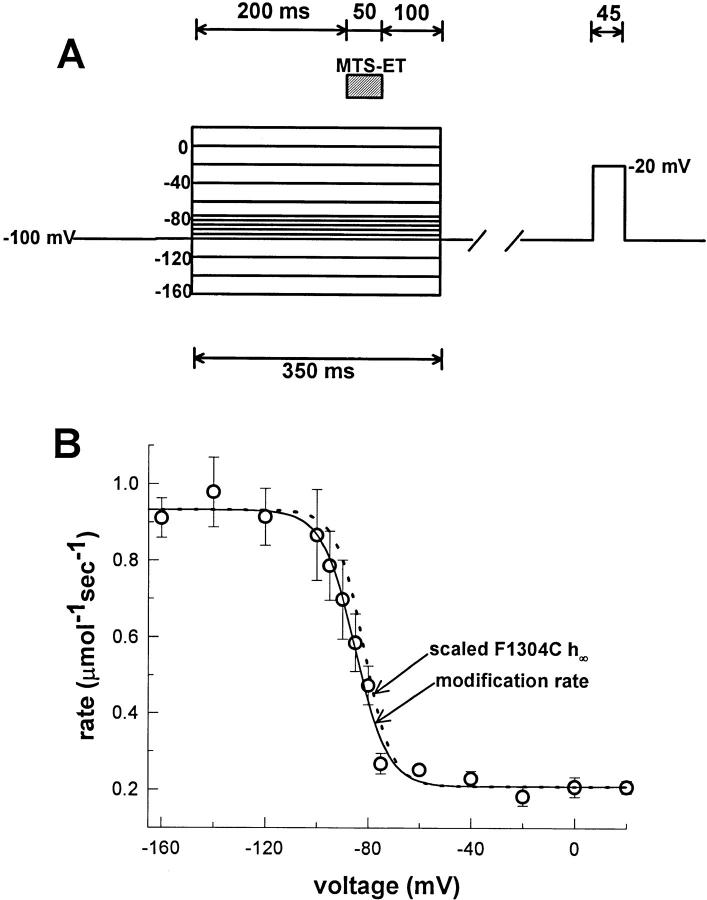
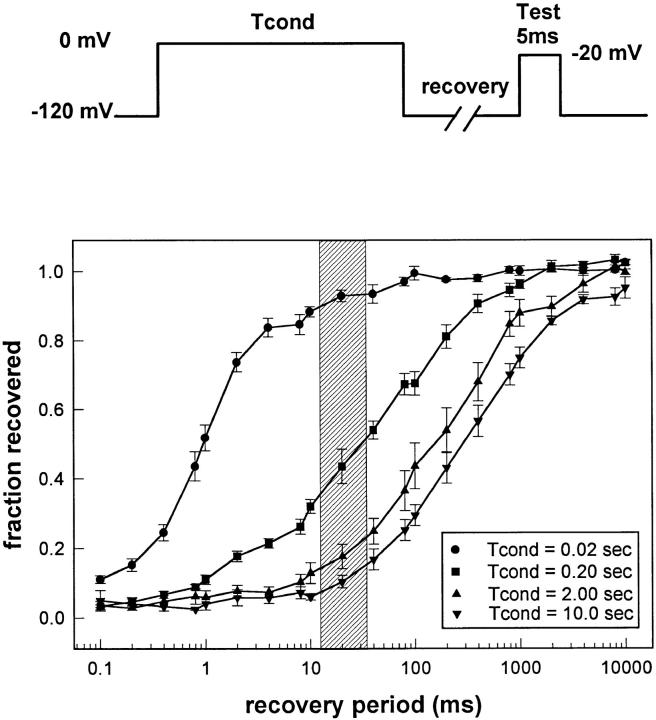
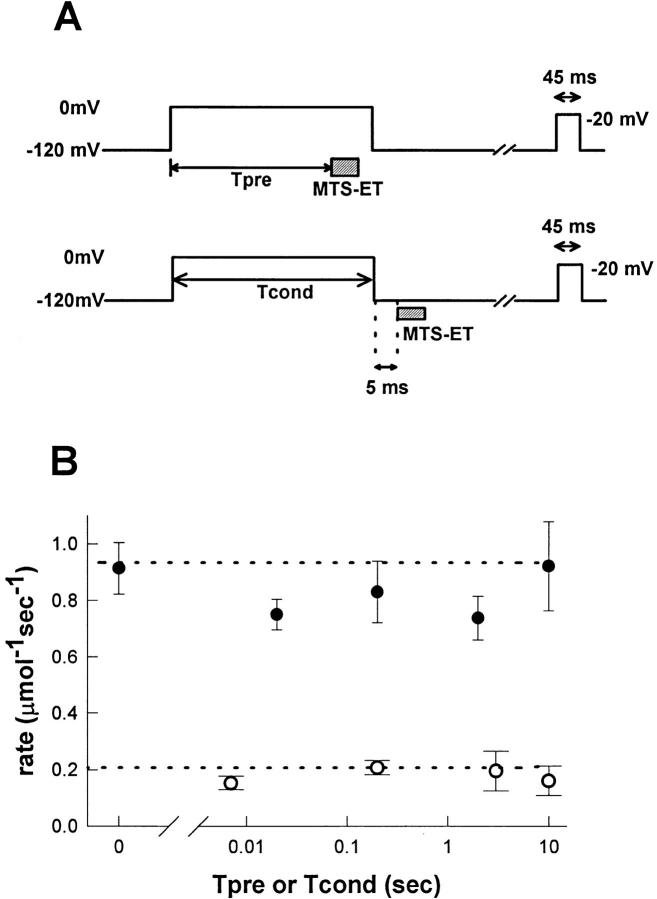
Voltage-gated Na+ channels exhibit two forms of inactivation, one form (fast inactivation) takes effect on the order of milliseconds and the other (slow inactivation) on the order of seconds to minutes. While previous studies have suggested that fast and slow inactivation are structurally independent gating processes, little is known about the relationship between the two. In this study, we probed this relationship by examining the effects of slow inactivation on a conformational marker for fast inactivation, the accessibility of a site on the Na+ channel III-IV linker that is believed to form a part of the fast inactivation particle. When cysteine was substituted for phenylalanine at position 1304 in the rat skeletal muscle sodium channel (microl), application of [2-(trimethylammonium)ethyl]methanethiosulfonate (MTS-ET) to the cytoplasmic face of inside-out patches from Xenopus oocytes injected with F1304C RNA dramatically disrupted fast inactivation and displayed voltage-dependent reaction kinetics that closely paralleled the steady state availability (hinfinity) curve. Based on this observation, the accessibility of cys1304 was used as a conformational marker to probe the position of the fast inactivation gate during the development of and the recovery from slow inactivation. We found that burial of cys1304 is not altered by the onset of slow inactivation, and that recovery of accessibility of cys1304 is not slowed after long (2-10 s) depolarizations. These results suggest that (a) fast and slow inactivation are structurally distinct processes that are not tightly coupled, (b) fast and slow inactivation are not mutually exclusive processes (i.e., sodium channels may be fast- and slow-inactivated simultaneously), and (c) after long depolarizations, recovery from fast inactivation precedes recovery from slow inactivation.


Figures

Figure 1
Figure 1
Mutation F1304C destabilizes fast inactivation. (A) Na+ currents were elicited from excised inside-out macropatches by depolarization to −20 mV from a holding potential of −120 mV. Averages of two current traces each for WT and mutant F1304C are shown normalized to peak amplitude and superimposed. Mutant channels display a slowed current decay and a greater fraction of persistent current. (B) Voltage dependence of steady state fast inactivation, h∞•(V), in response to a 200-ms prepulse, is right shifted for F1304C (V1/2 = −81.6 ± 1.3 mV, slope = 5.5 ± 0.5, n = 9), compared with WT (V1/2 = −98.3 ± 1.9, slope = 5.7 ± 0.3, n = 12). G(V), computed as peak I Na/(V − Erev), is similar for WT (n = 12) and F1304C (n = 9). These data are consistent with a destabilization of fast inactivation caused by substitution of cysteine for phenylalanine at site 1304.
Figure 2
Figure 2
MTS-ET disrupts fast inactivation of F1304C. (A) Selected current traces evoked by depolarization to −20 mV from −120 mV after successive 50-ms exposures to 4 μM MTS-ET are superimposed over a final trace measured after an additional 4 s of exposure (average of two individual records) and a control trace measured before any MTS-ET exposure (average of 10 individual records). MTS-ET application to the cytoplasmic face was accomplished by computer-controlled rapid solution switching (see materials and methods) from bath solution into 4 μM MTS-ET-containing bath solution. In this case, the peak current increased from −129 pA before exposure to −208 pA after the modification reached completion, and the persistent current (measured as the average current between 40 and 42 ms divided by the peak current) increased from 6.1% before exposure to 65.5% after the modification reached completion. (B) After each experiment, the kinetics of solution exchange was evaluated by switching the patch into a solution containing a sodium concentration equal to the pipette solution. The switching was timed to occur for 20 ms at the beginning of a depolarization to 0 from −120 mV. For this patch, there was a 7.4-ms delay from the time of the switching command before the current began to decay, and a monoexponential fit to the current decay gave a time constant for solution exchange of 1.7 ms. (C) The value of the fractional persistent current after each exposure is plotted against the cumulative exposure time. The curve was fit with a monoexponential approaching unity that had nonzero pedestal (solid line): F = (1 − F o)(1 − exp[−t expmod]) + F o, where τmod is the reciprocal of the reaction rate and was 0.279 s (corresponding to a rate of 0.895 μmol−1 s−1), and F o is the value of the fractional persistent current before modification (0.059).
Figure 3
Figure 3
Dose–response curve. Reaction rates for MTS-ET modification of F1304C are shown as a function of MTS-ET concentration used. All exposures were carried out at −120 mV and were either 50 (1 μM, n = 3; 2 μM, n = 6; and 4 μM, n = 10) or 25 (8 μM, n = 5) ms in duration. Rates were determined as described in Fig. 2. The dose–response curve was fit to an unweighted linear regression constrained to pass through the origin, giving a slope of 1.03 μmol−1 s−1.
Figure 4
Figure 4
Voltage dependence of F1304C accessibility. (A) The protocol for measuring the accessibility of site 1304 as a function of voltage is shown. 200-ms prepulses were used at each voltage, followed by 50 ms of exposure to 4 μM MTS-ET, and an additional 100 ms at the prepulse voltage to prevent unwanted exposure after repolarization. The time between the prepulse and the test pulse ranged from 3.5 to 18 s, according to the necessary recovery time at −100 mV after 350 ms at the prepulse voltage. Degree of modification was assessed with a 45-ms test pulse to −20 mV. (B) Reaction rates were determined as described in Fig. 2 and are plotted against the voltage at which the exposure occurred (average of n = 6 per voltage; all points at least n = 3). The curve was fit to a Boltzmann (solid line) with a nonzero pedestal: R(V) = (R max R min)/{1 + exp [(V - V1/2)/k]} + R min, where R max is the maximum rate (0.932 μmol−1 s−1), R min is the minimum rate (0.208 μmol−1 s−1), V1/2 is the voltage at half-maximal rate (−85.1 mV), and k is the slope factor (6.4). For comparison, the measured h∞• curve for F1304C (dotted line) is superimposed scaled to R max and R min (V1/2 = −81.6 ± 1.3 mV and k = 5.5 ± 0.5).
Figure 5
Figure 5
Recovery from inactivation. The two-pulse protocol (top) was used to assess recovery from inactivation in F1304C in response to varying length conditioning pulses. The time axis is displayed logarithmically because recovery rates vary over several orders of magnitude. Symbols indicate means ± SEM (n = 5–7 for each curve). Using this data, experimental protocols (diagrammed in Fig. 6 A) were designed to measure the accessibility of cys1304 when channels are slow inactivated. The shaded area indicates the duration of MTS-ET exposure during the protocol shown in Fig. 6 A (bottom).
Figure 6
Figure 6
Accessibility of site 1304 recovers rapidly for fast- and slow-inactivated channels. (A) Two protocols were used to measure accessibility of site 1304 in response to variable length conditioning pulses to 0 mV from a holding potential of −120 mV. In the experiment shown on top, the MTS-ET exposure was placed near the end of the conditioning pulse to verify that site 1304 remains buried during long depolarizations and to determine how quickly it becomes buried for short depolarizations. Depolarization was maintained throughout the exposure and shortly after. (Tpre = 0.007, 0.2, 2.0, or 10.0 s; MTS-ET exposure was 20 or 50 ms; [MTS-ET] = 4 or 8 μM; n = 3 for all). In the bottom protocol, the exposure was placed 5 ms after repolarization: 4 μM, 50 ms (average n = 5 per Tcond, except Tcond = 10 s) or 8 μM, 20 ms (average n = 8 per Tcond, all points at least n = 4). The total time between the end of the conditioning pulse and the beginning of the exposure includes a short delay due to lag of the switching apparatus, which we measured as described above (Fig. 2) to be 7.1 ± 0.1 ms, giving a preexposure recovery time of 12.1 ± 0.1 ms. Therefore, for the 20-ms case, exposure occurred from 12.1 to 32.1 ms after repolarization (depicted as the shaded area in the graph in Fig. 5). For both protocols, enough time after the conditioning pulse was allowed for complete recovery (from 5 s for Tcond = 0.02 s to 45 s for Tcond = 10 s) before the 45-ms test pulse was administered. (B) Reaction rates were determined as described above (Fig. 2) for the two protocols described in A. Dotted lines indicate R max (0.932 μmol−1 s−1) and R min (0.208 μmol−1 s−1). The reaction rates for the first protocol, in which the exposures occurred during the conditioning pulse (○) were slow, consistent with site 1304 burial. For the experiments in which the exposure occurred shortly after the end of the conditioning pulse (•), the measured rate was consistent with nearly complete accessibility (experiments without any conditioning pulse are shown for comparison as Tcond = 0). This result suggests that the fast inactivation gate recovers rapidly despite the fact that >90% of the channels remain slow inactivated.

Similar articles

Cited by

References

    1. Adelman W, Palti Y. The effect of external potassium and long duration voltage conditioning in the amplitude of sodium currents in the giant axon of the squid Loligo Pealei. . J Gen Physiol. 1969;54:589–606. - PMC - PubMed
    1. Almers W, Stanfield PR, Stühmer W. Slow changes in currents through sodium channels in frog muscle membrane. J Physiol (Camb) 1983;339:253–271. - PMC - PubMed
    1. Armstrong CM, Bezanilla F. Inactivation of the sodium channel. II. Gating current experiments. J Gen Physiol. 1977;70:567–590. - PMC - PubMed
    1. Baukrowitz T, Yellen G. Modulation of K+ current by frequency and external [K+]: a tale of two inactivation mechanisms. Neuron. 1995;15:951–960. - PubMed
    1. Bezanilla F, Taylor RE, Fernandez JM. Distribution and kinetics of membrane dielectric polarization. 1. Long-term inactivation of gating currents. J Gen Physiol. 1982;79:21–40. - PMC - PubMed

Publication types