. 1998 Jan;111(1):161-80.
doi: 10.1085/jgp.111.1.161.

Regulation of an inwardly rectifying ATP-sensitive K+ channel in the basolateral membrane of renal proximal tubule

Affiliations

Regulation of an inwardly rectifying ATP-sensitive K+ channel in the basolateral membrane of renal proximal tubule

U R Mauerer et al. J Gen Physiol. 1998 Jan.

Abstract

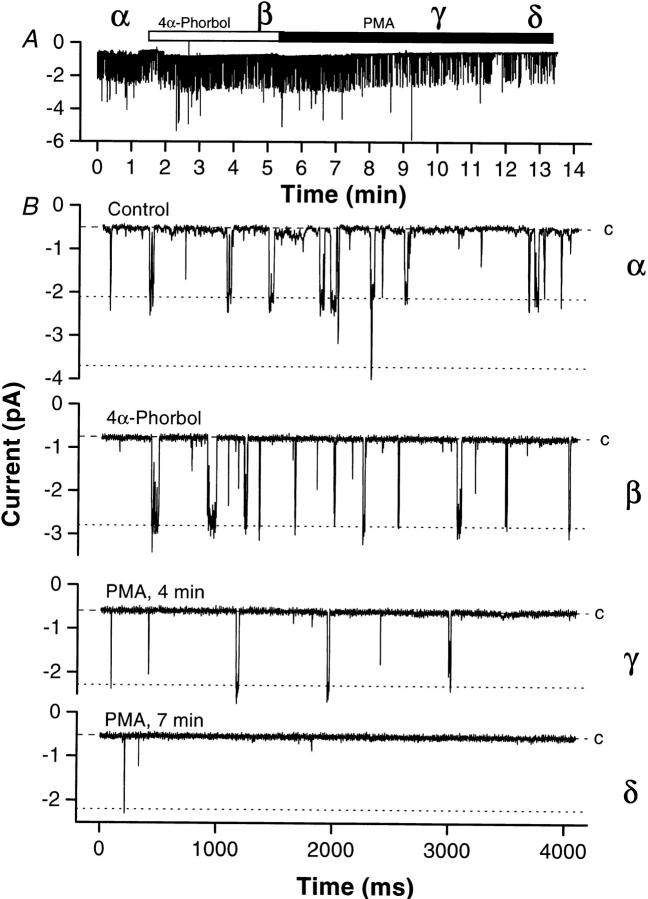
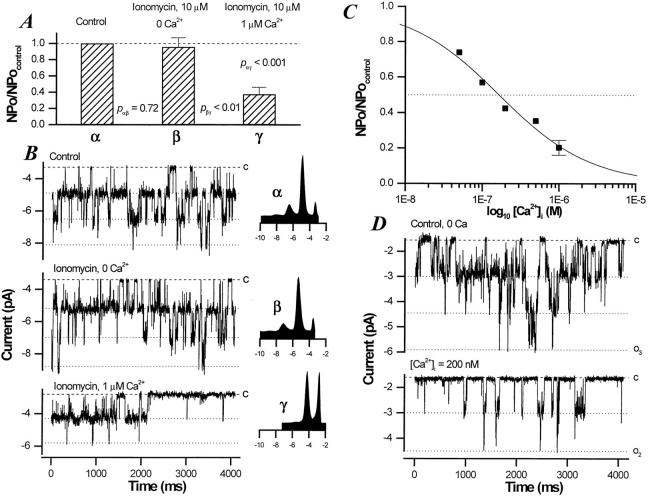
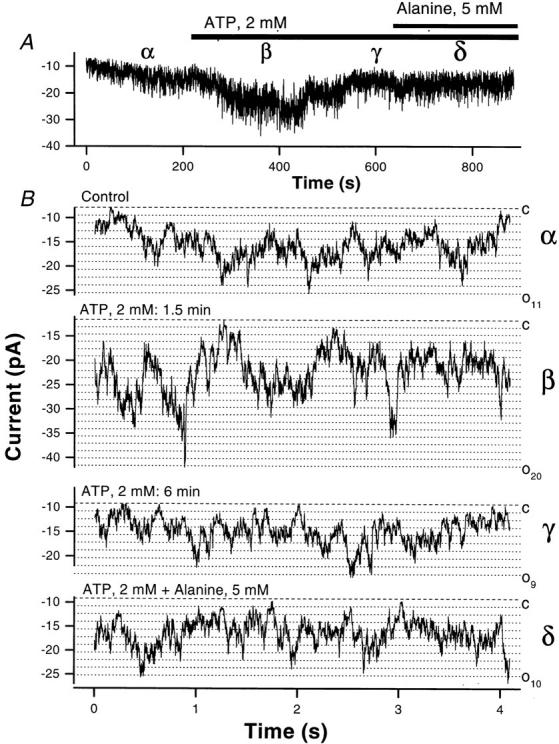
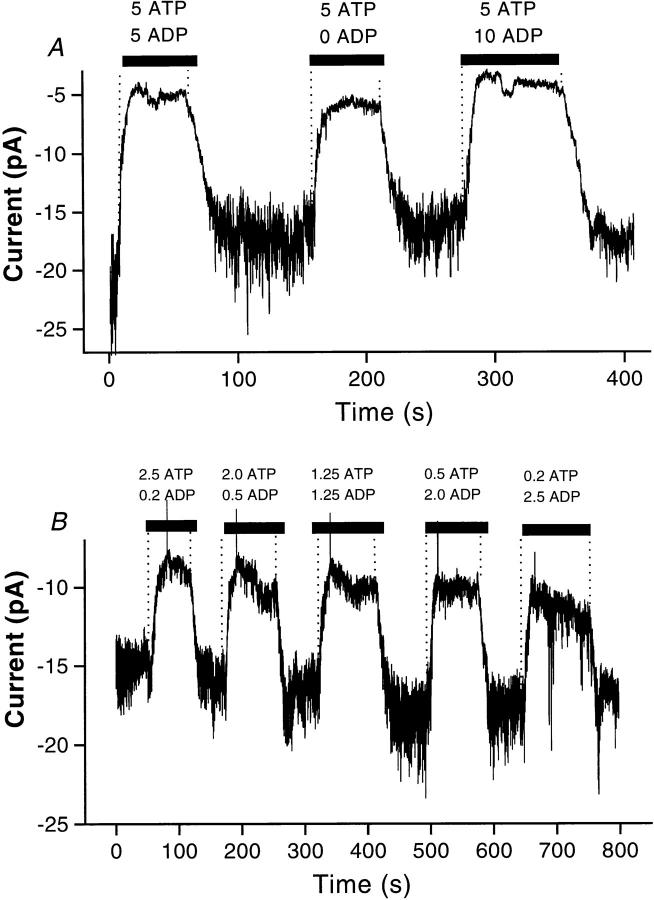
Functional coupling of Na+,K+-ATPase pump activity to a basolateral membrane (BLM) K+ conductance is crucial for sustaining transport in the proximal tubule. Apical sodium entry stimulates pump activity, lowering cytosolic [ATP], which in turn disinhibits ATP-sensitive K+ (KATP) channels. Opening of these KATP channels mediates hyperpolarization of the BLM that facilitates Na+ reabsorption and K+ recycling required for continued Na+,K+-ATPase pump turnover. Despite its physiological importance, little is known about the regulation of this channel. The present study focuses on the regulation of the BLM KATP channel by second messengers and protein kinases using membrane patches from dissociated, polarized Ambystoma proximal tubule cells. The channel is regulated by protein kinases A and C, but in opposing directions. The channel is activated by forskolin in cell-attached (c/a) patches, and by PKA in inside-out (i/o) membrane patches. However, phosphorylation by PKA is not sufficient to prevent channel rundown. In contrast, the channel is inhibited by phorbol ester in c/a patches, and PKC decreases channel activity (nPo) in i/o patches. The channel is pH sensitive, and lowering cytosolic pH reduces nPo. Increasing intracellular [Ca2+] ([Ca2+]i) in c/a patches decreases nPo, and this effect is direct since [Ca2+]i inhibits nPo with a Ki of approximately 170 nM in i/o patches. Membrane stretch and hypotonic swelling do not significantly affect channel behavior, but the channel appears to be regulated by the actin cytoskeleton. Finally, the activity of this BLM KATP channel is coupled to transcellular transport. In c/a patches, maneuvers that inhibit turnover of the Na+,K+-ATPase pump reduce nPo, presumably due to a rise in intracellular [ATP], although the associated cell depolarization cannot be ruled out as the possible cause. Conversely, stimulation of transport (and thus pump turnover) leads to increases in nPo, presumably due to a fall in intracellular [ATP]. These results show that the inwardly rectifying KATP channel in the BLM of the proximal tubule is a key element in the feedback system that links cellular metabolism with transport activity. We conclude that coupling of this KATP channel to the activity of the Na+,K+-ATPase pump is a mechanism by which steady state NaCl reabsorption in the proximal tubule may be maintained.


Figures

Figure 1
Figure 1
cAMP agonists activate the BLM KATP channel. (A) Forskolin (10 μM) activates the BLM KATP channel in cell-attached patches. In the experiment depicted, the pipette contains KCl (solution d), the bath contains NaCl (solution c), and the command potential is −60 mV. A running average of current versus time (window width 16 ms) is shown. (B) Sample traces taken from within the regions marked α, β, and γ in A. The corresponding amplitude histograms were taken for each region. After the addition of forskolin, channel activity increases ninefold (nP o increases from 0.17 to 1.46). Note the increase in the single channel current (i sc) due to the hyperpolarization of the cell membrane as K+ channels open over the BLM. The all channels closed level (dashed line) and open channel levels (dotted lines) are indicated. (C) Forskolin increases both channel activity (NPo) and single channel current (isc). nP o (▪) and i sc (○) as measured in the experiment described in A are plotted versus time. i sc increases as K+ channels on the BLM open. From the change in i sci sc = −0.9 pA), the hyperpolarization (ΔVm) is ∼−40 mV. Note that the increase in i sc precedes the increase in nP o, consistent with other BLM KATP channels opening before those in the patch.
Figure 2
Figure 2
The cAMP-dependent protein kinase directly activates the BLM KATP channel. In this inside-out experiment, the pipette contains KCl (solution d), the bath contains NaCl (solution c) plus 0.2 mM ATP, and the command potential is −60 mV. (A) The running average of current versus time (16-ms window) is shown. The catalytic subunit of PKA (csPKA, 100 U/ml) was added to the bath where indicated. (B) Original current traces representative of channel activity during the control period (top trace) and after stimulation by PKA (bottom three traces). In this experiment, PKA led to a fourfold increase in nP o. The all channels closed level (dashed line) and open channel levels (dotted lines) are indicated.
Figure 3
Figure 3
Phosphorylation itself does not prevent channel rundown. Activity of the BLM KATP channel is maintained in this representative inside-out patch excised in a bath containing 0.2 mM ATP, but rundown commences when the poorly hydrolyzable ATP-γS is substituted for ATP. Rundown continues despite subsequent addition of PKA, suggesting that phosphorylation per se does not rescue rundown of the BLM KATP channel.
Figure 4
Figure 4
PKA phosphorylation shortens the longest closed time of the BLM KATP channel. (A) Closed-time histogram for a KATP channel in a cell-attached patch at −60 mV before (top) and after (bottom) forskolin. (top) Logarithmically binned (Sigworth and Sine, 1987) data before forskolin was fitted with two probability density functions (dashed lines) to give the overall fit (solid line), yielding time constants of τc1 = 1.27 ms (74%) and τc2 = 397 ms (26%). (bottom) Logarithmically binned data after forskolin was fitted with two probability density functions (dashed lines) to give the overall fit (solid line) yielding time constants of τc1 = 0.81 ms (72%) and τc2 = 7 ms (28%). Note that the main effect of forskolin is to reduce the longest closed lifetime from 397 to 7 ms. Based on the bandwidth of the recording system, the data and the fit were cutoff at 500 μs (dotted vertical line). (B) Closed-time histogram for a KATP channel in an inside-out patch at −60 mV before (top) and after (bottom) csPKA. (top) Logarithmically binned data before csPKA were fitted with two probability density functions (dashed lines) to give the overall fit (solid line), yielding time constants of τc1 = 0.72 ms (48%) and τc2 = 502 ms (52%). (bottom) Logarithmically binned data after csPKA was fitted with two probability density functions (dashed lines) to give the overall fit (solid line), yielding time constants of τc1 = 1.5 ms (75%) and τc2 = 100 ms (25%). As was the case for forskolin, the main effect of PKA phosphorylation was to reduce the longest closed lifetime from 502 to 100 ms. Based on the bandwidth of the recording system, the data and the fit were cutoff at 500 μs (dotted vertical line).
Figure 5
Figure 5
Phorbol ester inhibits the BLM KATP channel. (A) PMA (10 μM) inhibits the BLM KATP channel in cell-attached patches. In the experiment depicted, the pipette contains KCl (solution d), the bath contains NaCl (solution c), and the command potential is −60 mV. A running average of current versus time (16-ms window) is shown. (B) Sample traces taken from within the regions marked α, β, and γ, and in A. Addition of 4α-PMA does not alter channel activity. After the addition of PMA, however, channel activity decreases by 85% (nP o decreases from 0.072 to 0.011). The all channels closed level (dashed line) and open channel levels (dotted lines) are indicated.
Figure 6
Figure 6
Protein kinase C inhibits the BLM KATP channel. PKC directly inhibits the BLM KATP channel. In this inside-out experiment, the pipette contains KCl (solution d), the bath contains NaCl (solution c) plus 0.2 mM ATP and 50 nM Ca2+, and the command potential is −60 mV. (A) The running average of current versus time (16-ms window) is shown. PKC (0.5 U/ml) was added to the bath where indicated. (B) Original current traces representative of channel activity during the control period (top trace) and after inhibition by PKC (bottom two traces). In this experiment, PKC produced an 89% decrease in nP o. The all channels closed level (dashed line) and open channel levels (dotted lines) are indicated.
Figure 7
Figure 7
Intracellular acidosis inhibits the BLM KATP channel. (A and B) Lowering pHi decreases channel activity in inside-out patches. In this inside-out experiment, the pipette contains KCl (solution d), the bath contains NaCl (solution c) plus 0.2 mM ATP, and the command potential is −60 mV. (A) The running average of current versus time (16-ms window) is shown. When the pH of the bath was lowered from 7.5 to 6.8, channel activity was inhibited by 79% (nP o changes from 0.67 to 0.14). This effect is reversible upon returning the bath pH to 7.5. (B) Original current traces representative of channel activity during the control period (pHi = 7.5, top), during acidosis (pHi = 6.8, middle), and after returning to pHi = 7.5 (bottom). The all channels closed level (dashed line) and open channel levels (dotted lines) are indicated. (C and D) Lowering pHi with nigericin decreases channel activity in cell-attached patches. In this cell-attached experiment, the pipette contains KCl (solution d), the bath contains NaCl with 2.5 mM KCl (solution c) plus 0.2 mM ATP, and the command potential is −80 mV. (C) The running average of current versus time (16-ms window) is shown. When nigericin (10 μM) was added to the bath, channel activity was progressively inhibited. nP o was reduced by 68% after 8 min in nigericin. (D) Original current traces and amplitude histograms representative of channel activity during the control period (top trace) and during nigericin (bottom two traces). The all channels closed level (dashed line) and open channel levels (dotted lines) are indicated.
Figure 8
Figure 8
Increases in [Ca2+]i inhibit the BLM KATP channel. (A and B) Elevation of [Ca2+]i decreases channel activity. (A) Summary of normalized channel activity from cell-attached patches in which bath [Ca2+] was increased in the presence of a calcium ionophore (ionomycin). The addition of 1 μM ionomycin in a Ca2+-free bath (solution c) does not significantly affect nP o (P = 0.72), but subsequent addition of 1 μM Ca2+ (solution e) leads to a 63 ± 9% (n = 4) reduction in nP o compared with control (P < 0.001). The inhibition tends to persist despite the removal of Ca2+ from a bath containing EGTA. (B) Representative single-channel traces and corresponding amplitude histograms for Ca2+-free bath (top), Ca2+-free bath plus ionomycin (middle), and 1 μM Ca2+ bath plus ionomycin (bottom). The all channels closed level (dashed line) and open channel levels (dotted lines) are indicated. (C and D) Increasing [Ca2+]i in inside-out patches directly inhibits channel activity. (C) Dose–response curve of channel activity versus [Ca2+]i. Fitting the data with the Hill equation (solid line) yields a K i = 166 nM and n H = 0.73. (D) Representative single channel traces for [Ca2+]i = 0 (top) and 200 (bottom) nM at a command potential of −60 mV.
Figure 9
Figure 9
Disrupting the actin cytoskeleton has a biphasic effect on the BLM KATP channel. Cytochalasin D (10 μM) has a biphasic effect on the BLM KATP channel. In this cell-attached patch, the pipette contains KCl (solution d), the bath contains NaCl (solution c), and the command potential is −60 mV. (A) A running average of current versus time (16-ms window) shows that channel activity increases within the first minute of treatment, but gradually declines thereafter. Irreversible inhibition of channel activity persists after washout of cytochalasin D from the bath. (B) Sample traces taken from within the regions marked α, β, γ, and δ in A. Corresponding amplitude histograms are given for each region. After the addition of cytochalasin D, channel activity initially increases, but subsequently declines to 18% of control activity (region marked γ: nP o = 0.14, compared with 0.78 during region α). The inhibition persists after washout of cytochalasin D (region marked δ: nP o = 0.01, 1% of control). Note the decrease in the single channel current (i sc) due to the depolarization of the cell membrane as K+ channels close over the BLM. The all channels closed level (dashed line) and open channel levels (dotted lines) are indicated.
Figure 10
Figure 10
Inhibition of transport decreases BLM KATP channel activity. (A) Inhibition of the Na+,K+-ATPase pump with ouabain (200 μM) results in a decrease in activity of the BLM KATP channel in cell-attached patches. A running average of current versus time (16-ms window) is shown. The application of ouabain caused nP o to decrease by 89% (region marked α: nP o = 0.46, region marked γ: nP o = 0.05) presumably due to an increase in [ATP]i. In this experiment, the pipette contains KCl (solution d), the bath contains NaCl (solution c), and the command potential is −60 mV. (B) Sample traces taken from within the regions marked α, β, and γ in A. The corresponding amplitude histograms were taken for each region. Note the decrease in the single channel current due to the depolarization of the cell membrane as K+ channels close over the BLM. The small channel appearing in the lower two traces is a CFTR-like Cl channel on the BLM previously described by us. An increase in [ATP]i may have led to the opening of the Cl channel. The all channels closed level (dashed line) and open channel levels (dotted lines) are indicated. (C) Inhibition of the Na+,K+-ATPase pump with a zero-K+ bath (solution c without KCl) also results in a decrease in activity of the BLM KATP channel in cell-attached patches. Sample traces taken at the times indicated show a progressive decrease in nP o (68%) and single channel current (control: nP o = 1.6, i sc = −1.6. Zero K+, 6 min: nP o = 0.51, i sc = −1.39) corresponding to duration in the zero-K+ bath. In this experiment, the pipette contains KCl (solution d) and the command potential is −80 mV. The all channels closed level (dashed line) and open channel levels (dotted lines) are indicated.
Figure 11
Figure 11
Stimulation of transport increases BLM KATP channel activity. (A) Activation of the Na+,K+-ATPase pump with substrates, in this case 5 mM alanine, results in an increase in activity of the BLM KATP channel in cell-attached patches. A running average of current versus time (16-ms window) is shown. The addition of alanine caused nP o to increase nearly twofold (region marked α: nP o = 2.53, region marked β: nP o = 4.44). In this experiment, the pipette contains KCl (solution d), the bath contains NaCl (solution c), and the command potential is −60 mV. Sample traces taken from within the regions marked α, β, and γ in A. Note that despite the opening of BLM KATP channels, the single channel current remains essentially constant due to a net balance of hyperpolarizing (K+ channel activation) and depolarizing (Na+ entry) forces. The all channels closed level (dashed line) and open channel levels (dotted lines) are indicated.
Figure 12
Figure 12
Stimulation of transport does not increase BLM KATP channel activity in ATP-loaded cells. Preloading the cell with ATP from the bath prevents the increase of BLM KATP channel activity due to alanine in cell-attached patches. A running average of current versus time (16-ms window) is shown in A, and sample traces are shown in B. Once inward K+ channel currents reached a steady state (region α, up to 11 open channels), 2 mM ATP added to the bath is taken up by the cell, which maintains a constant [ATP]i (see text for details). The initial activation of current (region β, up to 20 open channels) may represent the opening of KATP channels that had been quiescent due to a lack of ATP. Presumably, as [ATP]i continues to rise, KATP currents are inhibited (region γ, up to 9 open channels). In the presence of steady state currents and [ATP]i, the ability of alanine to increase channel activity is significantly diminished (region δ, up to 10 channels open). Similar results were observed in two other cells. In this experiment, the pipette contains KCl (solution d), the bath contains NaCl (solution c), and the command potential is −60 mV. The all channels closed level (dashed line) and open channel levels (dotted lines) are indicated.
Figure 13
Figure 13
ADP does not relieve the block by ATP in excised patches. (A) Neither ADP nor a decrease in the ATP:ADP ratio antagonize the block by 5 mM ATP. In this inside-out patch, the pipette contains KCl (solution d), the bath contains K-aspartate (solution i) to isolate K+ current, and the command potential is −60 mV, and a running average of current versus time (16-ms window) is shown. Adding 5 mM ATP and 5 mM ADP blocked 96% of the inward current. After washout (with 0.2 ATP), 5 mM ATP alone produced nearly the same inhibition (92%), indicating that ADP enhances rather than attenuates the ATP block. This notion is confirmed after washout, when 10 mM ADP in the presence of 5 mM ATP again enhances the block (98%), despite an ATP:ADP ratio of 0.5. (B) Varying the ATP:ADP ratio while keeping the [ATP + ADP] constant does not antagonize the block by ATP. In this inside-out patch, the pipette contains KCl (solution d), the bath contains K-aspartate (solution i) to isolate K+ current, and the command potential is −60 mV, and a running average of current versus time (16-ms window) is shown. The extent of block exerted by [ATP + ADP] = 2.5 mM was not significantly affected, while the ATP:ADP ratio varied from 12.5 to 0.08.
Figure 14
Figure 14
Summary of the regulation of BLM KATP channel activity. (A) A simplified model of transcellular transport in the proximal tubule is shown. Driven by the electrochemical gradient, Na+ enters the cell across the apical membrane in exchange for protons or together with low molecular substrates like amino acids or glucose. Cl is taken up across the apical membrane by Cl-base exchange and leaves the cell across the BLM through a CFTR-like Cl channel. Na+ is pumped out of the cell across the BLM by means of the Na+,K+,ATPase pump, which breaks down ATP and brings K+ ions into the cell. For steady state transport to continue, K+ has to recycle across the BLM. Recycling is mediated by basolateral KATP channels, which is activated by PKA and by the fall in [ATP]i induced by the action of the pump when transport is stimulated. The BLM KATP channel is inhibited by decreased pHi, increased [Ca2+]i, PKC, and increases in [ATP]i when transport is inhibited. This model links apical uptake of Na+ to cellular metabolism (ATP), which in turn is linked to the basolateral K+ conductance. (B) The dual effect of ATP: in the presence of Mg2+, a low concentration (100–200 μM) of ATP (or another hydrolyzable nucleotide triphosphate) is required to maintain KATP channel activity by acting at a high affinity nucleotide hydrolysis site (NHS). However, millimolar levels of ATPi (or another NTP, NDP, or NMP) inhibit the channel, presumably by binding to a low affinity nucleotide binding domain (NBD). Nucleotide hydrolysis does not appear to be necessary for the inhibitory action of nucleotides at the NBD. K channel openers such as diazoxide may act by interfering with nucleotide binding to the NBD.

Similar articles

Cited by

References

    1. Allard B, Lazdunski M. Nucleotide diphosphates activate the ATP-sensitive potassium channel in mouse skeletal muscle. Pflügers Arch. 1992;422:185–192. - PubMed
    1. Ashcroft SJ, Ashcroft FM. Properties and functions of ATP-sensitive K-channels. Cell Signal. 1990;2:197–214. - PubMed
    1. Balaban RS, Mandel LJ, Soltoff SP, Storey JM. Coupling of active ion transport and aerobic respiratory rate in isolated renal tubules. Proc Natl Acad Sci USA. 1980;77:447–451. - PMC - PubMed
    1. Beck JS, Hurst AM, Lapointe JY, Laprade R. Regulation of basolateral K channels in proximal tubule studied during continuous microperfusion. Am J Physiol. 1993;264:F496–F501. - PubMed
    1. Beck JS, Laprade R, Lapointe JY. Coupling between transepithelial Na transport and basolateral K conductance in renal proximal tubule [editorial] Am J Physiol. 1994;266:F517–F527. - PubMed

Publication types

MeSH terms