. 1998 Jan;18(1):608-15.
doi: 10.1128/MCB.18.1.608.

Human IAP-like protein regulates programmed cell death downstream of Bcl-xL and cytochrome c

Affiliations

Human IAP-like protein regulates programmed cell death downstream of Bcl-xL and cytochrome c

C S Duckett et al. Mol Cell Biol. 1998 Jan.

Abstract

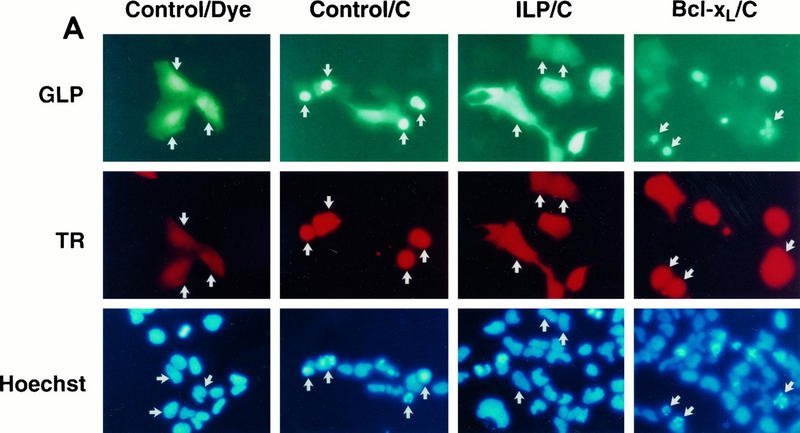
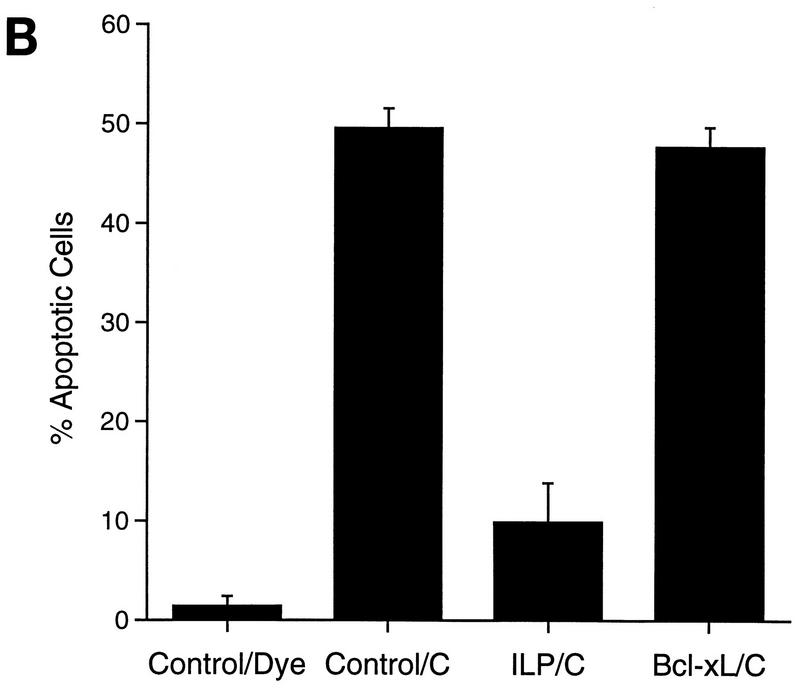
The gene encoding human IAP-like protein (hILP) is one of several mammalian genes with sequence homology to the baculovirus inhibitor-of-apoptosis protein (iap) genes. Here we show that hILP can block apoptosis induced by a variety of extracellular stimuli, including UV light, chemotoxic drugs, and activation of the tumor necrosis factor and Fas receptors. hILP also protected against cell death induced by members of the caspase family, cysteine proteases which are thought to be the principal effectors of apoptosis. hILP and Bcl-xL were compared for their ability to affect several steps in the apoptotic pathway. Redistribution of cytochrome c from mitochondria, an early event in apoptosis, was not blocked by overexpression of hILP but was inhibited by Bcl-xL. In contrast, hILP, but not Bcl-xL, inhibited apoptosis induced by microinjection of cytochrome c. These data suggest that while Bcl-xL may control mitochondrial integrity, hILP can function downstream of mitochondrial events to inhibit apoptosis.


Figures

FIG. 1
FIG. 1
hILP blocks cell death induced by a variety of stimuli. (A) MCF7F cells were transfected with pEBB (formula image
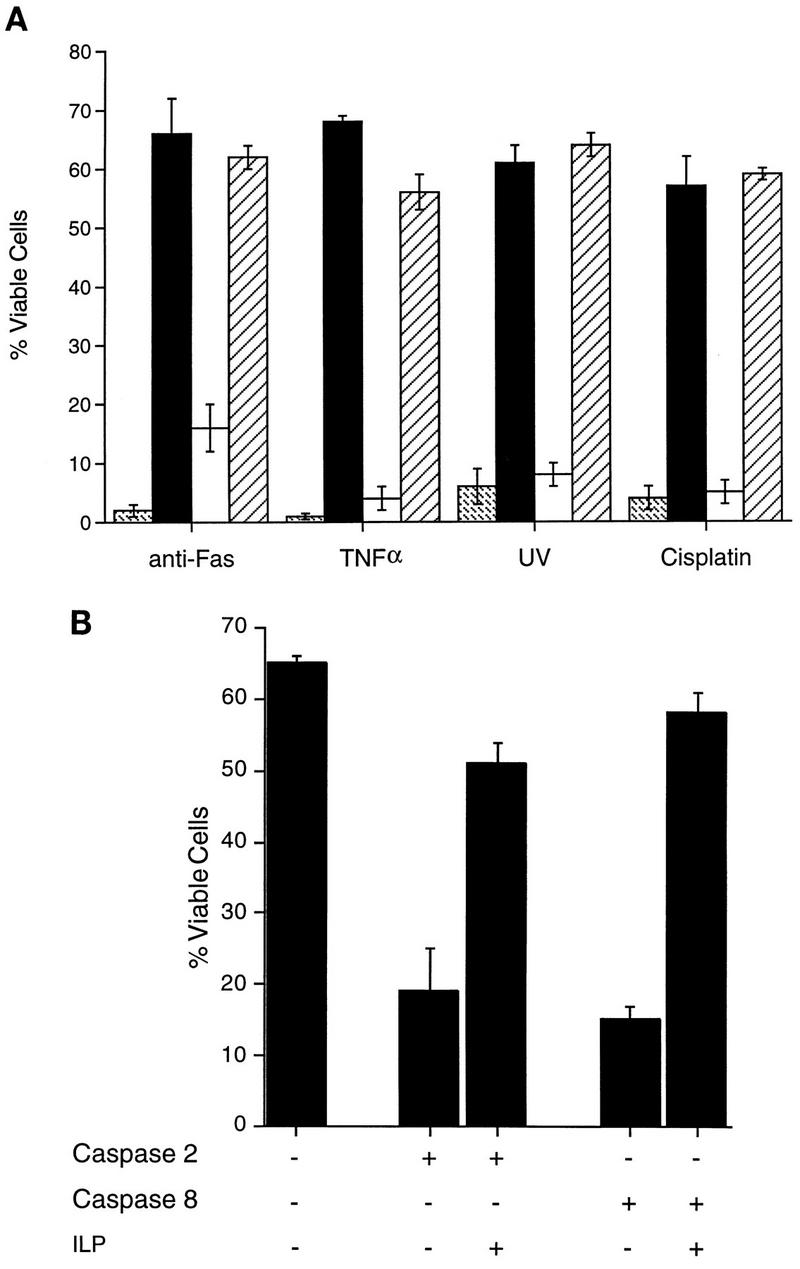
), pEBB-hILP (▪), pCI (□), or pCI-Bcl-xL (▨). Twenty-four hours after transfection, cells were treated with fresh medium or medium supplemented with either anti-Fas antibody and cycloheximide, rhTNF-α, or cisplatin or were exposed to UV. After 12 h, cells were fixed, stained for β-galactosidase expression, and scored for apoptotic morphology. (B) MCF7F cells were transfected with pCMV-lacZ together with pcDNA3, pcDNA3-caspase 2, or pcDNA3-caspase 8 with or without cotransfection of pEBB-hILP expression vector. At 24 h after transfection, cells were fixed, stained for β-galactosidase expression, and scored for apoptotic morphology. Results are expressed as percent viable cells (number of flat blue cells/number of flat and round blue cells × 100). The data represent means ± standard deviations (n = 3).
FIG. 2
FIG. 2
Deletion analysis of hILP. (A) Schematic diagram of hILP showing deletion mutants. BIR domains (solid boxes), the amphipathic region (open box), and the ring finger (hatched box) are shown. WT, wild type. (B) MCF7F cells were transfected with pCMV-lacZ and either pEBB, pEBB-hILP, or pEBB deletion mutants of hILP. After 24 h, medium was removed and replaced with either fresh medium alone or fresh medium plus rhTNF-α. Cells were incubated for 12 h, at which time cells were fixed, stained for β-galactosidase expression, and scored for apoptotic morphology. The expression of FLAG-tagged deletion constructs was confirmed by immunoblotting with anti-FLAG bioM5 (Kodak) (data not shown). Results are expressed as percent viable cells (number of flat blue cells/number of flat and round blue cells × 100). The data represent the means ± standard deviations (n = 3).
FIG. 3
FIG. 3
hILP does not interact with TRAF proteins. 293 cells were cotransfected with the indicated mammalian GST expression vectors, together with expression vectors encoding each of the six indicated TRAF proteins. Lysates were precipitated by incubation with glutathione agarose beads, and TRAF proteins were identified by Western blot analysis as described in Materials and Methods. The expression of the GST chimeric proteins was also confirmed by using an anti-GST antibody (data not shown).
FIG. 4
FIG. 4
Bcl-xL, but not hILP, blocks the redistribution of cytochrome c. (A) MCF7 cells were transiently transfected with the indicated plasmids together with pCMV-GLP. Twenty-four hours after transfection, cells were treated with rhTNF-α and cycloheximide or with medium alone. Six hours after treatment, cells were fixed, immunostained for cytochrome c (CYTO C), mounted, and observed by phase-contrast and fluorescent microscopy. Representative fields are shown. Note the punctate staining of cytochrome c in the pEBB-transfected cells without TNF-α and the Bcl-xL-transfected cells treated with TNF. In contrast, note the diffuse cytochrome c staining in the pEBB- and ILP-transfected cells treated with TNF-α; nontransfected cells whose cytochrome c has not redistributed are included in these fields for comparison. CONT, pEBB transfected. (B) Quantitative analysis of cytochrome c redistribution. GLP-positive cells were scored for cytochrome c release, and the data were expressed as percent positive cells (number of GLP-positive cells with diffuse cytochrome c staining/total number of GLP-positive cells × 100). The data represent means ± standard deviations (n = 2). Open bars represent data collected from cells cultured in medium alone, while solid bars represent data collected from cells cultured in the presence of TNF-α.
FIG. 4
FIG. 4
Bcl-xL, but not hILP, blocks the redistribution of cytochrome c. (A) MCF7 cells were transiently transfected with the indicated plasmids together with pCMV-GLP. Twenty-four hours after transfection, cells were treated with rhTNF-α and cycloheximide or with medium alone. Six hours after treatment, cells were fixed, immunostained for cytochrome c (CYTO C), mounted, and observed by phase-contrast and fluorescent microscopy. Representative fields are shown. Note the punctate staining of cytochrome c in the pEBB-transfected cells without TNF-α and the Bcl-xL-transfected cells treated with TNF. In contrast, note the diffuse cytochrome c staining in the pEBB- and ILP-transfected cells treated with TNF-α; nontransfected cells whose cytochrome c has not redistributed are included in these fields for comparison. CONT, pEBB transfected. (B) Quantitative analysis of cytochrome c redistribution. GLP-positive cells were scored for cytochrome c release, and the data were expressed as percent positive cells (number of GLP-positive cells with diffuse cytochrome c staining/total number of GLP-positive cells × 100). The data represent means ± standard deviations (n = 2). Open bars represent data collected from cells cultured in medium alone, while solid bars represent data collected from cells cultured in the presence of TNF-α.
FIG. 5
FIG. 5
hILP, but not Bcl-xL, blocks cytochrome c-induced apoptosis. (A) 293 cells were transiently transfected with pCMV-GLP and either pEBB, pEBB-hILP, pCI, or pCI-Bcl-xL. After 24 to 48 h, GLP-positive cells were microinjected with Texas red dye alone (TR) or dye plus 3 mg of cytochrome c per ml (C). Two hours after injection, cells were incubated with Hoechst dye 33342, fixed, mounted, and observed by phase-contrast and fluorescent microscopy. Representative fields are shown. Note the condensed and fragmented nuclei in the cytochrome c-injected cells (red fluorescence) transfected with vector or Bcl-xL (green fluorescence) and the absence of such nuclei in the hILP-transfected cells. (B) Quantitative analysis of apoptosis induced by cytochrome c microinjection. GLP/Texas red-positive cells were scored for condensed (apoptotic) nuclei. Results are expressed as percent apoptotic cells (number of cells with apoptotic nuclei/number of TR-positive cells × 100). The data represent means ± standard deviations (n = 3).
FIG. 5
FIG. 5
hILP, but not Bcl-xL, blocks cytochrome c-induced apoptosis. (A) 293 cells were transiently transfected with pCMV-GLP and either pEBB, pEBB-hILP, pCI, or pCI-Bcl-xL. After 24 to 48 h, GLP-positive cells were microinjected with Texas red dye alone (TR) or dye plus 3 mg of cytochrome c per ml (C). Two hours after injection, cells were incubated with Hoechst dye 33342, fixed, mounted, and observed by phase-contrast and fluorescent microscopy. Representative fields are shown. Note the condensed and fragmented nuclei in the cytochrome c-injected cells (red fluorescence) transfected with vector or Bcl-xL (green fluorescence) and the absence of such nuclei in the hILP-transfected cells. (B) Quantitative analysis of apoptosis induced by cytochrome c microinjection. GLP/Texas red-positive cells were scored for condensed (apoptotic) nuclei. Results are expressed as percent apoptotic cells (number of cells with apoptotic nuclei/number of TR-positive cells × 100). The data represent means ± standard deviations (n = 3).

Similar articles

Cited by

References

    1. Alnemri E S, Livingston D J, Nicholson D W, Salvesen G, Thornberry N A, Wong W W, Yuan J. Human ICE/CED-3 protease nomenclature. Cell. 1996;87:171. - PubMed
    1. Armstrong R, Aja T, Xiang J, Gaur S, Krebs J, Hoang K, Bai X, Korsmeyer S, Karanewsky D, Fritz L, Tomaselli K. Fas-induced activation of the cell death related protease CPP32 is inhibited by Bcl-2 and by ICE family protease inhibitors. J Biol Chem. 1996;271:16850–16855. - PubMed
    1. Armstrong, R. C. Unpublished observations.
    1. Bertin J, Armstrong R C, Ottilie S, Martin D A, Wang Y, Banks S, Wang G H, Senkevich T G, Alnemri E S, Moss B, Lenardo M J, Tomaselli K J, Cohen J I. Death effector domain-containing herpesvirus and poxvirus proteins inhibit both Fas- and TNFR1-induced apoptosis. Proc Natl Acad Sci USA. 1997;94:1172–1176. - PMC - PubMed
    1. Bertin J, Mendrysa S M, LaCount D J, Gaur S, Krebs J F, Armstrong R C, Tomaselli K J, Friesen P D. Apoptotic suppression by baculovirus P35 involves cleavage by and inhibition of a virus-induced Ced-3/ICE-like protease. J Virol. 1996;70:6251–6259. - PMC - PubMed

Publication types

MeSH terms