

Patterns of variance in stage-structured populations: evolutionary predictions and ecological implications
- PMID: 9419355
- PMCID: PMC34554
- DOI: 10.1073/pnas.95.1.213
Patterns of variance in stage-structured populations: evolutionary predictions and ecological implications
Abstract
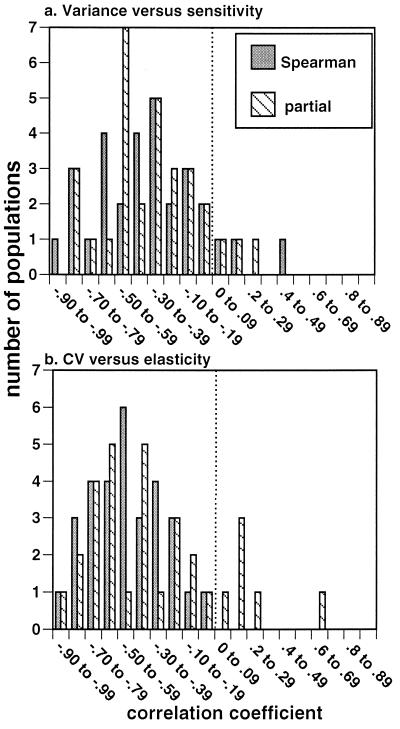
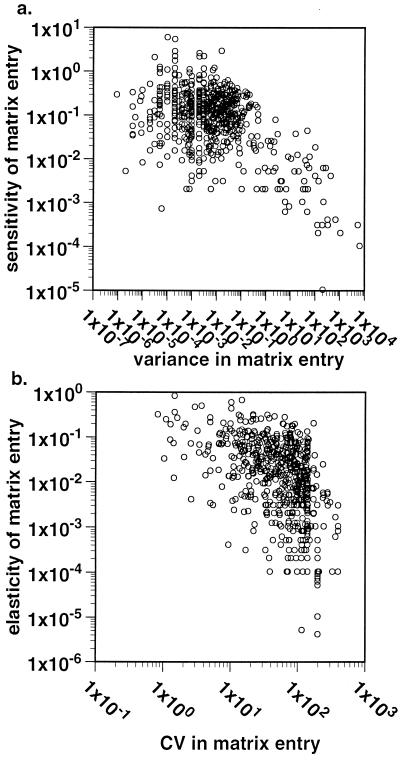
Variability in population growth rate is thought to have negative consequences for organism fitness. Theory for matrix population models predicts that variance in population growth rate should be the sum of the variance in each matrix entry times the squared sensitivity term for that matrix entry. I analyzed the stage-specific demography of 30 field populations from 17 published studies for pattern between the variance of a demographic term and its contribution to population growth. There were no instances in which a matrix entry both was highly variable and had a large effect on population growth rate; instead, correlations between estimates of temporal variance in a term and contribution to population growth (sensitivity or elasticity) were overwhelmingly negative. In addition, survivorship or growth sensitivities or elasticities always exceeded those of fecundity, implying that the former two terms always contributed more to population growth rate. These results suggest that variable life history stages tend to contribute relatively little to population growth rates because natural selection may alter life histories to minimize stages with both high sensitivity and high variation.
Figures
References
-
- Lewontin R C, Cohen D. Proc Natl Acad Sci USA. 1969;12:366–373.
-
- Meats A. Oecologia. 1971;6:223–237. - PubMed
-
- Tuljapurker S D, Orzack S H. Theor Pop Biol. 1980;18:314–342.
-
- Tuljapurkar S D. Theor Pop Biol. 1982;21:114–140.
Publication types
MeSH terms
LinkOut - more resources
Full Text Sources
