. 1998 Jan 6;95(1):247-52.
doi: 10.1073/pnas.95.1.247.

Assaying genome-wide recombination and centromere functions with Arabidopsis tetrads

Affiliations

Assaying genome-wide recombination and centromere functions with Arabidopsis tetrads

G P Copenhaver et al. Proc Natl Acad Sci U S A. .

Abstract

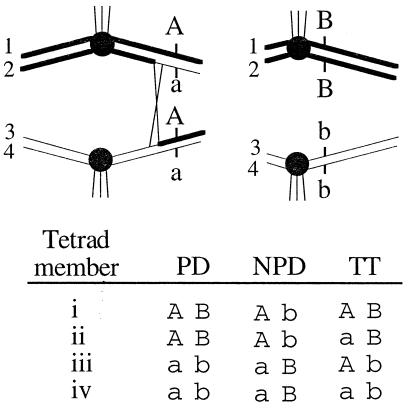
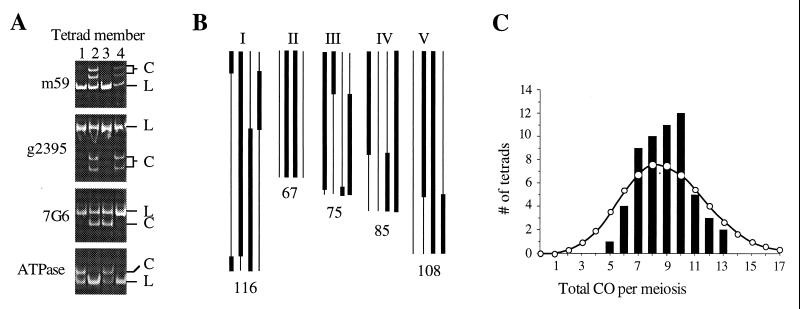
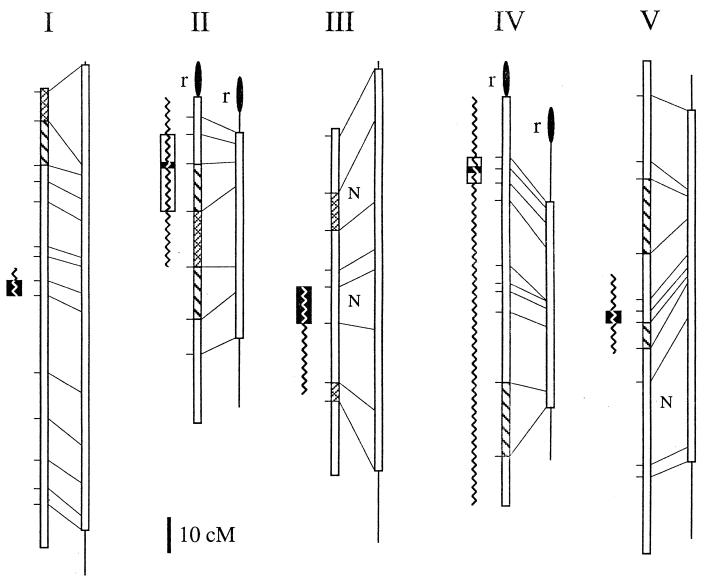
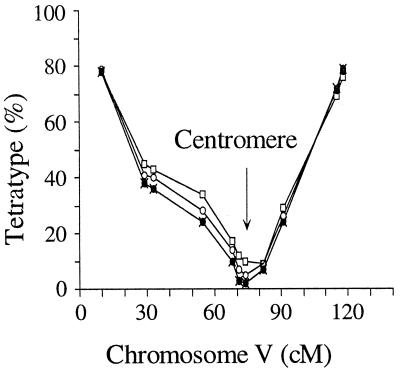
During meiosis, crossover events generate new allelic combinations, yet the abundance of these genetic exchanges in individual cells has not been measured previously on a genomic level. To perform a genome-wide analysis of recombination, we monitored the assortment of genetic markers in meiotic tetrads from Arabidopsis. By determining the number and distribution of crossovers in individual meiotic cells, we demonstrated (i) surprisingly precise regulation of crossover number in each meiosis, (ii) considerably reduced recombination along chromosomes carrying ribosomal DNA arrays, and (iii) an inversely proportional relationship between recombination frequencies and chromosome size. This use of tetrad analysis also achieved precise mapping of all five Arabidopsis centromeres, localizing centromere functions in the intact chromosomes of a higher eukaryote.


Figures

Figure 1
Figure 1
Genetic analysis of marker assortment in tetrads. (Top) Two homologous pairs of chromosomes and their four chromatids (–4) are shown at metaphase of meiosis I. Spindle fiber attachments (vertical lines) to the centromeres (filled circles) result in the separation of homologous centromeres. Two genetic loci (A and B) with Columbia (upper case) and Landsberg (lower case) alleles are shown. Recombination events (X) frequently separate distal markers (such as A) from the centromere. (Bottom) The results of scoring DNA markers in each of the members of a tetrad (i–iv) reveal the genotype. COs and the orientation of homologs at meiosis I dictate whether marker pairs assort into one of three categories: parental ditype (PD), nonparental ditype (NPD), or TT. TT patterns result only when recombination between a markers and its centromere occurs (as in the example shown at Top).
Figure 2
Figure 2
(A) PCR amplification products for four polymorphic Landsberg (L) or Columbia (C) markers on chromosome I for each of the members (–4) of the tetrad shown in B. (B) Map of recombination in one tetrad. The genotype of the four chromatids (bar = Columbia, line = Landsberg) for chromosomes I–V and approximate CO positions are shown. The genetic distance sampled is indicated at the bottom of each chromosome and totals 451 cM. (C) Histogram of the number of COs in each meiosis (bars) and a Poisson distribution with the same mean of 8.9 (circles). Deviation of the observed distribution from the Poisson was determined by testing χ squared for frequencies divided into ≥−2 classes (33).
Figure 3
Figure 3
Genetic maps of Arabidopsis chromosomes I–V. For each column, on the left is the published map from male and female meioses (ref. ; http://nasc.nott.ac.uk/new_ri_map.html) and on the right is a male-specific meiotic map calculated by using the data presented here (the lines at the extremities of the male-specific map represent unsampled regions). Marker positions (horizontal lines), corresponding markers on both maps (diagonal lines), intervals with observed nonparental ditype tetrads (N), regions of enhanced (cross-hatched boxes) and reduced (hatched boxes) recombination in males, and rDNA (filled ovals) are indicated. Centromere positions as defined by recombinant individuals at the markers assayed (open boxes) and calculated by a mapping function (solid boxes; see Materials and Methods) are shown at the left of each chromosome map. Centromeres for chromosomes I–V were mapped between 7G6 and T27K12 (52–59 cM), m246 and THY1 (11–33 cM), GL1 and NIT1 (45–55 cM), GA1 and nga8 (17–29 cM), and nga76 and PHYC (71–74 cM), respectively. At each centromeric interval, there are 6, 14, 15, 7, and 2 (chromosomes I–V, respectively) recombinants remaining. On chromosomes 2 and 4, no recombinants were detected at mi310 and nga12, respectively. Previous centromere localizations derived from chromosome fragmentation experiments are displayed as jagged lines (35, 36).
Figure 4
Figure 4
%TT for markers on chromosome V calculated by comparison to centromere-linked markers. Four plots, using centromeric markers on chromosomes I-IV (filled and open symbols) provide a consensus location for the centromere (arrow).

References

    1. Mather K, Beale G H. J Genetics. 1942;43:1–30.
    1. Perkins D D. Genetics. 1949;34:607–626. - PMC - PubMed
    1. Petes T D, Malone R E, Symington L S. In: The Molecular and Cellular Biology of the Yeast Saccharomyces. Broach J R, Jones E S, Pringle J R, editors. Plainview, NY: Cold Spring Harbor Lab. Press; 1991. pp. 407–521.
    1. Carbon J, Clarke L. New Biol. 1990;2:10–19. - PubMed
    1. Fogel S, Hurst D D. Genetics. 1967;57:455–481. - PMC - PubMed

Publication types

LinkOut - more resources