. 1998 Jan 6;95(1):334-9.
doi: 10.1073/pnas.95.1.334.

Large-scale temporal gene expression mapping of central nervous system development

Affiliations

Large-scale temporal gene expression mapping of central nervous system development

X Wen et al. Proc Natl Acad Sci U S A. .

Abstract

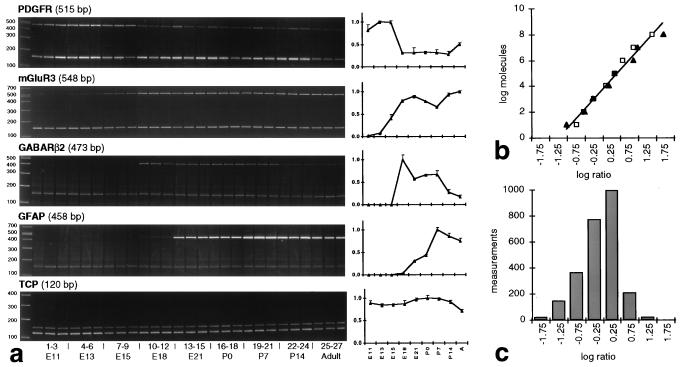
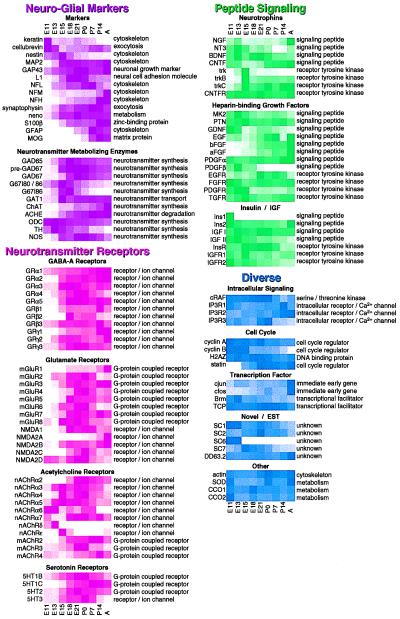
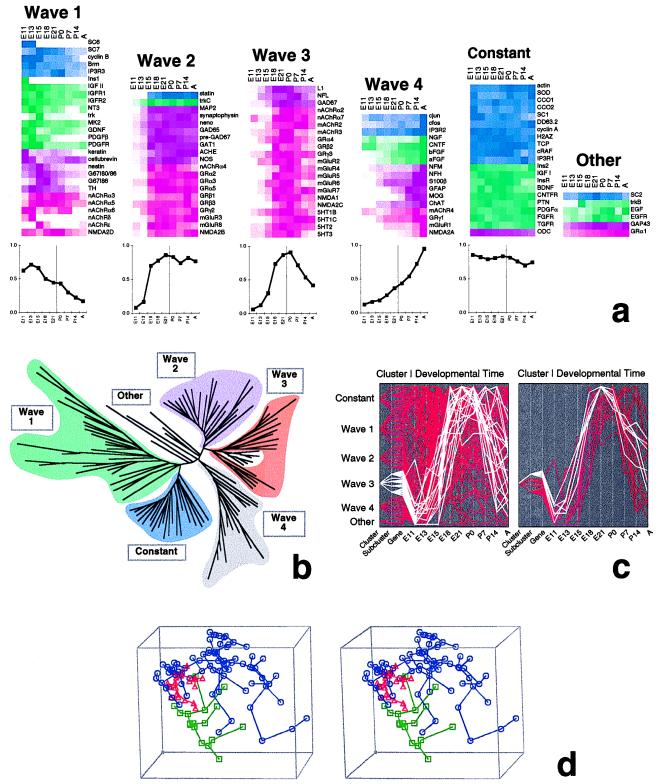
We used reverse transcription-coupled PCR to produce a high-resolution temporal map of fluctuations in mRNA expression of 112 genes during rat central nervous system development, focusing on the cervical spinal cord. The data provide a temporal gene expression "fingerprint" of spinal cord development based on major families of inter- and intracellular signaling genes. By using distance matrices for the pair-wise comparison of these 112 temporal gene expression patterns as the basis for a cluster analysis, we found five basic "waves" of expression that characterize distinct phases of development. The results suggest functional relationships among the genes fluctuating in parallel. We found that genes belonging to distinct functional classes and gene families clearly map to particular expression profiles. The concepts and data analysis discussed herein may be useful in objectively identifying coherent patterns and sequences of events in the complex genetic signaling network of development. Functional genomics approaches such as this may have applications in the elucidation of complex developmental and degenerative disorders.


Figures

Figure 1
Figure 1
RT-PCR/PAGE assay. (a) Analysis of representative ethidium bromide-stained polyacrylamide gels. Bands at 150 bp are the PAW 108 internal control PCR product. Every PCR band is from a different animal. Time series of normalized ratiometric densitometry data (averaged ± SEM) are graphed to the right of each gel. (b) Dynamic range of RT-PCR assay. The relationship between the log(starting molecules) and the log(product/control) ratio is linear between 10 and 108 molecules for GAD65 (squares) and GAD67 (triangles; for details, see ref. 4). (c) Range of ratiometric values. The histogram shows the distribution of densitometrically determined product ratios. The measurement values (c) are comfortably within the linear range of the log–log assay (b), far removed from potential saturation.
Figure 2
Figure 2
Temporal gene expression map of the developing spinal cord. Expression patterns are labeled according to gene name and general functional class. Densitometry data from ratiometric RT-PCR and PAGE for triplicate animals are shown for each time point. Darkest, maximal expression; white, undetectable expression. MAP2, microtubule-associated protein 2; GAP43, growth-associated protein 43; L1, neural cell adhesion molecule (NCAM); NFL, NFM, NFH, neurofilament light, medium, and heavy; neno, neuron-specific enolase; GFAP, glial fibrillary acidic protein; MOG, myelin-oligodendrocyte glycoprotein; GAD65, glutamate decarboxylase 65; GAD67, G67I80/86, and G67I86, glutamate decarboxylase 67 splice variants; GAT1, GABA transporter 1; ChAT, choline acetyltransferase; AChE, acetylcholinesterase; ODC, ornithine decarboxylase; TH, tyrosine hydroxylase; NOS, nitric oxide synthase; GR, GABA receptor; mGluR, metabotropic glutamate receptor; NMDA, NMDA receptor; nAChR, nicotinic acetylcholine receptor; mAChR, muscarinic acetylcholine receptor; 5HT, serotonin (5-hydroxytryptamine) receptor; NGF, nerve growth factor; NT3, neurotrophin 3; BDNF, brain-derived neurotrophic factor; CNTF, ciliary neurotrophic factor (CNTFR, receptor); trk, NGF receptor; MK2, midkine 2; PTN, pleiotrophin; GDNF, glial-derived neurotrophic factor; EGF and EGFR, epidermal growth factor and its receptor; bFGF, aFGF, basic and acidic fibroblast growth factor; PDGF and PDGFR, platelet-derived growth factor and its receptor; FGFR, fibroblast growth factor receptor; TGFR, transforming growth factor receptor; Ins, insulin; InsR, insulin receptor; IGF, insulin-like growth factor; IGFR, IGF receptor; CRAF, c-raf protooncogene; IP3R, inositol 1,4,5-trisphosphate receptor; H2AZ, H2A.Z histone protein; Brm, brahma; TCP, t-complex protein; SOD, superoxide dismutase; CCO1 and CCO2, cytochrome c oxidase, subunits 1 and 2.
Figure 3
Figure 3
Gene expression waves. (a) Normalized gene expression trajectories from Fig. 2 are shown grouped by “waves” determined by Euclidean distance clustering. The graphs below show the average normalized expression pattern or “wave” over the nine time points for all the genes in each cluster (the time of birth is marked by a vertical line). Within each wave, genes are grouped according to gene families, not according to proximity as determined by Euclidean distance. (b) Euclidean distance tree of all gene expression patterns (for annotated tree, see http://rsb.info.nih.gov/mol-physiol/PNAS/tree.html). Major branches correspond to waves in a. (c) Plots of all normalized time series, highlighting wave 3 (Left, white lines) and a subcluster of wave 3 (Right, white lines plotted on top of remaining genes of wave 3 in red). Subclusters (secondary branching) were selected by visual inspection from tree in b; e.g., the plotted time series of the wave 3 subcluster correspond to the branchlet highlighted in white within wave 3 in b. (d) Principal component analysis. Principal components projection viewed as a three-dimensional stereo plot. Each point mapped in three-dimensional space represents an expression time series corresponding to a gene in Fig. 2. Highlighted points correspond to Euclidean distance wave 3 (red triangles), wave 4 (green squares), and the remaining genes (blue octagons). Abbreviations are as in Fig. 2.

References

    1. Crossin K L. Perspect Dev Neurobiol. 1994;2:21–32. - PubMed
    1. Shastry B S. Mol Cell Biochem. 1994;136:171–182. - PubMed
    1. Somogyi R, Sniegoski C A. Complexity. 1996;1(6):45–63.
    1. Somogyi R, Wen X, Ma W, Barker J L. J Neurosci. 1995;15:2575–2591. - PMC - PubMed
    1. Felsenstein J. phylip (Phylogeny Inference Package), version 3.5c. Univ. of Washington, Seattle: Department of Genetics; 1993.

LinkOut - more resources