

Regional differences in the cellular immune response to experimental cutaneous or visceral infection with Leishmania donovani
- PMID: 9423834
- PMCID: PMC107853
- DOI: 10.1128/IAI.66.1.18-27.1998
Regional differences in the cellular immune response to experimental cutaneous or visceral infection with Leishmania donovani
Abstract
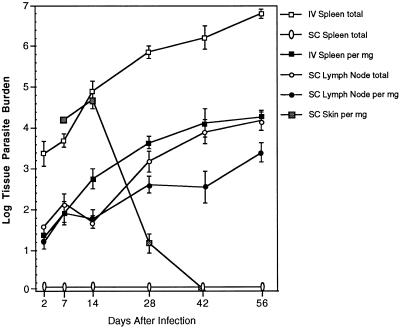
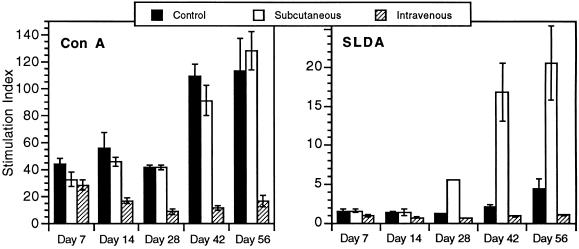
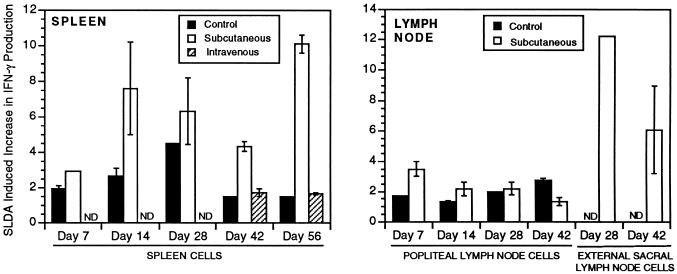
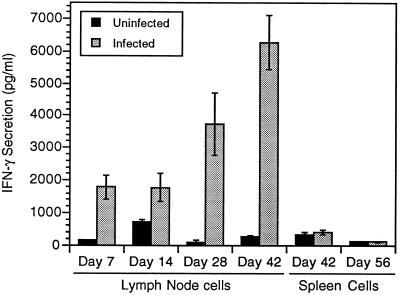
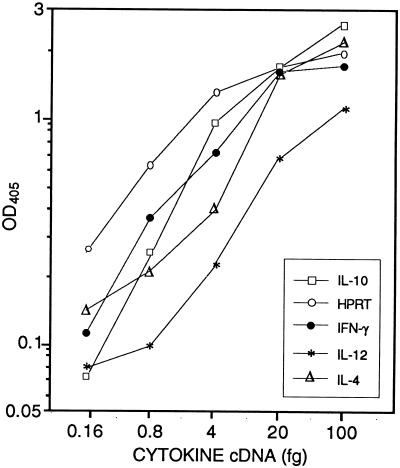
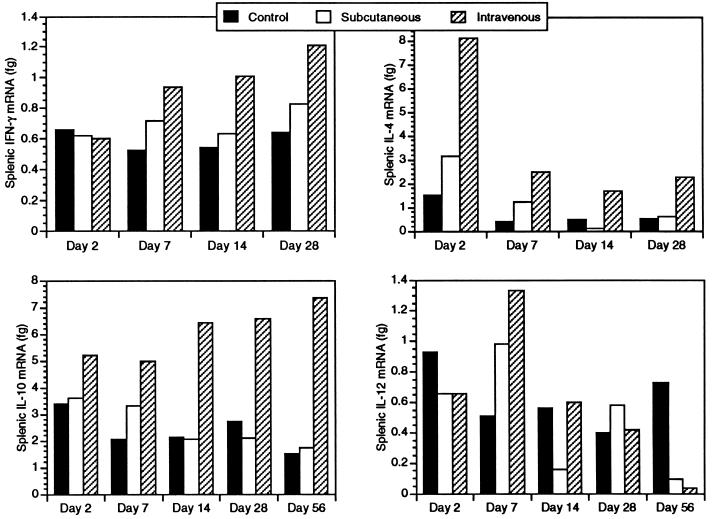
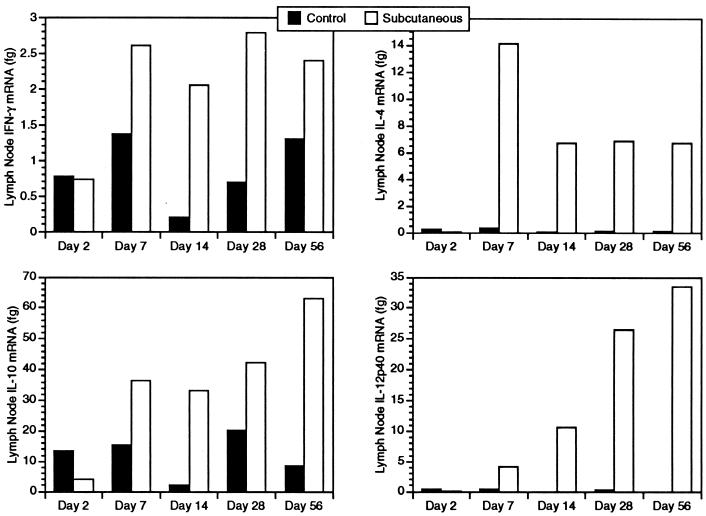
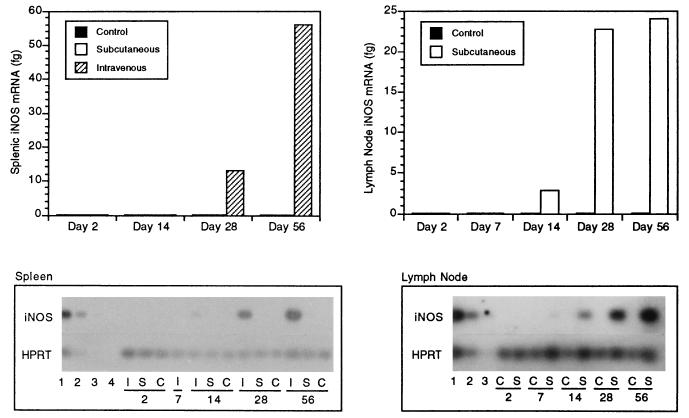
Infection with the protozoan Leishmania donovani can cause serious visceral disease or subclinical infection in humans. To better understand the pathogenesis of this dichotomy, we have investigated the host cellular immune response to cutaneous or visceral infection in a murine model. Mice infected in the skin developed no detectable visceral parasitism, whereas intravenous inoculation resulted in hepatosplenomegaly and an increasing visceral parasite burden. Spleen cells from mice with locally controlled cutaneous infection showed strong parasite-specific proliferative and gamma interferon (IFN-gamma) responses, but spleen cells from systemically infected mice were unresponsive to parasite antigens. The in situ expression of IFN-gamma, interleukin-4 (IL-4), IL-10, IL-12, and inducible nitric oxide synthase (iNOS) mRNAs was determined in the spleen, draining lymph node (LN), and cutaneous site of inoculation. There was considerably greater expression of IFN-gamma and IL-12 p40 mRNAs in the LN draining a locally controlled cutaneous infection than in the spleen following systemic infection. Similarly, there was a high level of IFN-gamma production by LN cells following subcutaneous infection but no IFN-gamma production by spleen cells following systemic infection. Splenic IL-4 expression was transiently increased early after systemic infection, but splenic IL-10 transcripts increased throughout the course of visceral infection. IL-4 and IL-10 mRNAs were also increased in the LN following cutaneous infection. iNOS mRNA was detected earlier in the LN draining a cutaneous site of infection compared to the spleen following systemic challenge. Thus, locally controlled cutaneous infection was associated with antigen-specific spleen cell responsiveness and markedly increased levels of IFN-gamma, IL-12, and iNOS mRNA in the draining LN. Progressive splenic parasitism was associated with an early IL-4 response, markedly increased IL-10 but minimal IL-12 expression, and delayed expression of iNOS.
Figures
Similar articles
-
Complete protection against experimental visceral leishmaniasis with complete soluble antigen from attenuated Leishmania donovani promastigotes involves Th1-immunity and down-regulation of IL-10.Eur J Immunol. 2009 Aug;39(8):2146-60. doi: 10.1002/eji.200839017. Eur J Immunol. 2009. PMID: 19593771
-
The IL-33/ST2 axis is associated with human visceral leishmaniasis and suppresses Th1 responses in the livers of BALB/c mice infected with Leishmania donovani.mBio. 2013 Sep 17;4(5):e00383-13. doi: 10.1128/mBio.00383-13. mBio. 2013. PMID: 24045639 Free PMC article.
-
The hamster as a model of human visceral leishmaniasis: progressive disease and impaired generation of nitric oxide in the face of a prominent Th1-like cytokine response.J Immunol. 2001 Feb 1;166(3):1912-20. doi: 10.4049/jimmunol.166.3.1912. J Immunol. 2001. PMID: 11160239
-
Distinct immunological states in murine cutaneous leishmaniasis by immunising with different amounts of antigen: the generation of beneficial, potentially harmful, harmful and potentially extremely harmful states.Behring Inst Mitt. 1997 Feb;(98):153-9. Behring Inst Mitt. 1997. PMID: 9382736 Review.
-
Interferon-gamma and interleukin-4 in human Leishmania donovani infections.Immunol Cell Biol. 1993 Dec;71 ( Pt 6):583-7. doi: 10.1038/icb.1993.64. Immunol Cell Biol. 1993. PMID: 8314285 Review.
Cited by
-
Performance of LBSap vaccine after intradermal challenge with L. infantum and saliva of Lu. longipalpis: immunogenicity and parasitological evaluation.PLoS One. 2012;7(11):e49780. doi: 10.1371/journal.pone.0049780. Epub 2012 Nov 26. PLoS One. 2012. PMID: 23189161 Free PMC article.
-
Infrared fluorescent imaging as a potent tool for in vitro, ex vivo and in vivo models of visceral leishmaniasis.PLoS Negl Trop Dis. 2015 Mar 31;9(3):e0003666. doi: 10.1371/journal.pntd.0003666. eCollection 2015 Mar. PLoS Negl Trop Dis. 2015. PMID: 25826250 Free PMC article.
-
Leishmania donovani p36(LACK) DNA vaccine is highly immunogenic but not protective against experimental visceral leishmaniasis.Infect Immun. 2001 Aug;69(8):4719-25. doi: 10.1128/IAI.69.8.4719-4725.2001. Infect Immun. 2001. PMID: 11447143 Free PMC article.
-
Cloning of Syrian hamster (Mesocricetus auratus) cytokine cDNAs and analysis of cytokine mRNA expression in experimental visceral leishmaniasis.Infect Immun. 1998 May;66(5):2135-42. doi: 10.1128/IAI.66.5.2135-2142.1998. Infect Immun. 1998. PMID: 9573100 Free PMC article.
-
Malnutrition-related parasite dissemination from the skin in visceral leishmaniasis is driven by PGE2-mediated amplification of CCR7-related trafficking of infected inflammatory monocytes.PLoS Negl Trop Dis. 2023 Jan 11;17(1):e0011040. doi: 10.1371/journal.pntd.0011040. eCollection 2023 Jan. PLoS Negl Trop Dis. 2023. PMID: 36630476 Free PMC article.
References
-
- Alard P, Lantz O, Sebagh M, Calvo C F, Weill D, Chavanel G, Senik A, Charpentier B. A versatile ELISA-PCR assay for mRNA quantitation from a few cells. BioTechniques. 1993;15:730–737. - PubMed
-
- Badaro R, Jones T C, Carvalho E M, Sampaio D, Reed S G, Barral A, Teixeira R, Johnson W D. New perspectives on a subclinical form of visceral leishmaniasis. J Infect Dis. 1986;154:1003–1011. - PubMed
-
- Barral-Netto M, Barral A, Brownell C E, Skeiky Y A W, Ellingsworth L R, Twardzik D R, Reed S G. Transforming growth factor-β in leishmanial infection: a parasite escape mechanism. Science. 1992;257:545–548. - PubMed
-
- Bogdan C, Vodovotz Y, Paik J, Xie Q-W, Nathan C. Mechanism of suppression of nitric oxide synthase expression by interleukin 4 in primary mouse macrophages. J Leukocyte Biol. 1994;55:227–233. - PubMed
Publication types
MeSH terms
Substances
LinkOut - more resources
Full Text Sources
