. 1997 Dec;37(23):3327-38.
doi: 10.1016/s0042-6989(97)00121-1.

The "independent components" of natural scenes are edge filters

Affiliations

The "independent components" of natural scenes are edge filters

A J Bell et al. Vision Res. 1997 Dec.

Abstract

It has previously been suggested that neurons with line and edge selectivities found in primary visual cortex of cats and monkeys form a sparse, distributed representation of natural scenes, and it has been reasoned that such responses should emerge from an unsupervised learning algorithm that attempts to find a factorial code of independent visual features. We show here that a new unsupervised learning algorithm based on information maximization, a nonlinear "infomax" network, when applied to an ensemble of natural scenes produces sets of visual filters that are localized and oriented. Some of these filters are Gabor-like and resemble those produced by the sparseness-maximization network. In addition, the outputs of these filters are as independent as possible, since this infomax network performs Independent Components Analysis or ICA, for sparse (super-gaussian) component distributions. We compare the resulting ICA filters and their associated basis functions, with other decorrelating filters produced by Principal Components Analysis (PCA) and zero-phase whitening filters (ZCA). The ICA filters have more sparsely distributed (kurtotic) outputs on natural scenes. They also resemble the receptive fields of simple cells in visual cortex, which suggests that these neurons form a natural, information-theoretic coordinate system for natural images.


Figures

FIGURE 1
FIGURE 1
The Blind Linear hnage Synthesis model (Olshausen & Field, 1996). Each patch, x, of an image is viewed as a linear combination of several (here three) underlying basis functions, given by the matrix A, each associated with an element of an underlying vector of “causes”, s. In this paper, causes are viewed as statistically independent “image sources”. The causes are recovered (in a vector u) by a matrix of filters, W, more loosely “receptive fields”, which attempt to invert the unknown mixing of unknown basis functions constituting image formation.
FIGURE 2
FIGURE 2
A schematic depiction of weight-space. A subspace of all matrices W, here represented by the loop (of course it is a much higher-dimensional closed subspace), has the property of decorrelating the input vectors, x. On this manifold, several special linear transformations can be distinguished: PCA (global in space and local in frequency), ZCA (local in space and global in frequency), and ICA. a privileged decorrelating matrix which, if it exists, decorrelates higher- as well as second-order moments. ICA filters are localized, but not down to the single pixel level, as ZCA filters are (see Fig. 3.)
FIGURE 3
FIGURE 3
Selected decorrelating filters and their basis functions extracted from the natural scene data. Each type of decorrelating filter yielded 144 12 × 12 filters, of which we only display a subset here. Each column contains filters or basis functions of a particular type, and each of the rows has a number relating to which row of the filter or basis function matrix is displayed. (a) PCA (Wp): The first, fifth, seventh etc principal components, calculated from equation (7), showing increasing spatial frequency. There is no need to show basis functions and filters separately here since for PCA, they are the same thing. (b) ZCA (Wz): The first six entries in this column show the 1-pixel wide centre-surround filter which whitens while preserving the phase spectrum. All are identical, but shifted. The lower six entries (37, 60… 144) show the basis functions instead, which are the columns of the inverse of the Wz matrix. (c) W: the weights learnt by the ICA network trained on Wz-whitened data, showing (in descending order) the DC filter, localized oriented filters, and localized checkerboard filters. (d) WI: The corresponding ICA filters, calculated according to WI = WWz, looking like whitened versions of the W-filters. (e) A: the corresponding basis functions, or columns of WI1. These are the patterns which optimally stimulate their corresponding ICA filters, while not stimulating any other ICA filter, so that WIA = I.
FIGURE 4
FIGURE 4
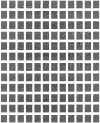
The matrix of 144 filters obtained by training on ZCA-whitened natural images. Each filter is a row of the matrix W. The ICA basis functions on ZCA-whitened data are visually the same as the ICA filters.
FIGURE 5
FIGURE 5
Log distributions of univariate statistics of the outputs of ICA, ZCA and PCA filters, averaged over all filters of each type. All three are approximately double-exponential distributions, but the more kurtotic ICA distribution is slightly peakier and has a longer tail, showing that it is sparser than the others. This distribution (and the 2-D ones in Fig. 6), although averaged over the outputs of all filters, are extremely similar to the distributions output by individual filters (respectively, pairs of filters). The only exception is the DC-filter (top left in Fig. 4) which has a more gaussian distribution.
FIGURE 6
FIGURE 6
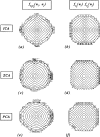
Contour plots of log distributions of pairwise statistics of the outputs of ICA, ZCA and PCA filters. Left column: joint log distributions averaged over all pairs of output filters of each type, and all images. Right column: product of marginal (univariate) distributions. The ICA solution best satisfies the independence criterion that the joint distribution has the same form as the product of the marginal distributions.

Similar articles

Cited by

References

    1. Amari S, Cichocki A, Yang HH. Advances in neural information processing systems. Vol. 8. MIT Press; Cambridge, MA: 1996. A new learning algorithm for blind signal separation.
    1. Atick JJ. Could information theory provide an ecological theory of sensory processing? Network. 1992;3:213–251. - PubMed
    1. Atick JJ, Redlich AN. Towards a theory of early visual processing. Neural Computation. 1990;2:308–320.
    1. Atick JJ, Redlich AN. Convergent algorithm for sensory receptive field development. Neural Computation. 1993;5:45–60.
    1. Baddeley R. Searching for filters with “interesting” output distributions: an uninteresting direction to explore? Network. 1996 in press. - PubMed

Publication types