. 1998 Jan 19;187(2):177-83.
doi: 10.1084/jem.187.2.177.

Interleukin 10 secretion and impaired effector function of major histocompatibility complex class II-restricted T cells anergized in vivo

Affiliations

Interleukin 10 secretion and impaired effector function of major histocompatibility complex class II-restricted T cells anergized in vivo

J Buer et al. J Exp Med. .

Abstract

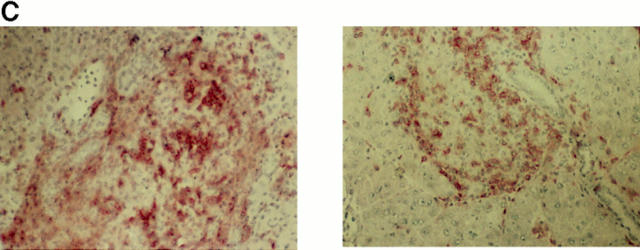
Continuous antigenic stimulation in vivo can result in the generation of so-called "anergic" CD4(+) or CD8(+) T cells that fail to proliferate upon antigenic stimulation and fail to develop cytolytic effector functions. Here we show that class II major histocompatibility complex-restricted T cells specific for influenza hemagglutinin (HA) that become anergic in mice expressing HA under control of the immunoglobulin kappa promoter exhibit an impaired effector function in causing diabetes in vivo, as compared to their naive counterparts, when transferred into immunodeficient recipients expressing HA under the control of the insulin promoter. Furthermore, HA-specific T cells anergized in vivo contain higher levels of interleukin (IL)-4 messenger RNA (mRNA) than naive and recently activated T cells with the same specificity and more than a 100-fold higher levels of IL-10 mRNA. The higher expression of the IL-10 gene is also evident at the protein level. These findings raise the interesting possibility that T cells rendered anergic in vivo have in fact become regulatory T cells that may influence neighboring immune responses through the release of IL-10.


Figures

Figure 1
Figure 1
Proliferation of splenocytes from TCR-HA or from TCR-HA × IG-HA mice upon antigenic stimulation in vitro. 2 × 10⁵ spleen cells were stimulated with 5 × 10⁵ irradiated BALB/c splenocytes in the presence of the indicated amounts of peptide or with coated 6.5 antibody at 100 μg/ml. IL-2 (30 UI/ml) was added to cells stimulated with the 6.5 antibody. Total cpm values were divided by the number of 6.5+ cells/well as determined by flow cytometry. Each bar represents mean values of triplicate determinations for each mouse. Response of splenocytes from each mouse to stimulation with immobilized CD3 antibody was similar (not shown).
Figure 2
Figure 2
Detection of transferred cells in the lymph nodes and pancreas of RAG−/− INS-HA recipients 11 d after transfer. (A) Splenocytes from TCR-HA or from TCR-HA × IG-HA mice were stained with F23.1 and 6.5 mAbs, and F23.1+6.5hi cells were gated as shown and were sorted accordingly. The purity of the cell populations after sorting was 97 and 95%, respectively. RAG−/− × INS-HA recipients were injected with 105 6.5hi cells from TCR-HA or TCR-HA × IG-HA mice, and were analyzed 11 d after transfer; the recipient of T cells from TCR-HA shown was diabetic, whereas the recipient of cells from the TCR-HA × IG-HA donor was not. For B, two-color staining with the F23.1 and the 6.5 mAbs was performed on lymph node cell suspensions from each recipient. For C, the pancreas of the same mice (the left and right sections correspond to the recipient of 6.5 cells from the TCR-HA or the TCR-HA × IG-HA mouse, respectively) was frozen and sections were stained with a mixture of CD4 and CD8 antibodies and revealed with AEC as described in Materials and Methods. The 6.5 mAb was not used because of its poor performance on histology sections, but isolation and staining of infiltrating lymphocytes in the pancreas of other transfered mice confirmed that they were all 6.5 positive. Note the total disruption of the anatomical structure of the pancreas having received the naive cells (left). Original magnification was 160 for both sections.
Figure 2
Figure 2
Detection of transferred cells in the lymph nodes and pancreas of RAG−/− INS-HA recipients 11 d after transfer. (A) Splenocytes from TCR-HA or from TCR-HA × IG-HA mice were stained with F23.1 and 6.5 mAbs, and F23.1+6.5hi cells were gated as shown and were sorted accordingly. The purity of the cell populations after sorting was 97 and 95%, respectively. RAG−/− × INS-HA recipients were injected with 105 6.5hi cells from TCR-HA or TCR-HA × IG-HA mice, and were analyzed 11 d after transfer; the recipient of T cells from TCR-HA shown was diabetic, whereas the recipient of cells from the TCR-HA × IG-HA donor was not. For B, two-color staining with the F23.1 and the 6.5 mAbs was performed on lymph node cell suspensions from each recipient. For C, the pancreas of the same mice (the left and right sections correspond to the recipient of 6.5 cells from the TCR-HA or the TCR-HA × IG-HA mouse, respectively) was frozen and sections were stained with a mixture of CD4 and CD8 antibodies and revealed with AEC as described in Materials and Methods. The 6.5 mAb was not used because of its poor performance on histology sections, but isolation and staining of infiltrating lymphocytes in the pancreas of other transfered mice confirmed that they were all 6.5 positive. Note the total disruption of the anatomical structure of the pancreas having received the naive cells (left). Original magnification was 160 for both sections.
Figure 3
Figure 3
Detection of insulin-producing cells in the pancreas of RAG−/− INS-HA recipients. Mice transferred with 6.5hi cells from a TCR-HA (left) or from a TCR-HA × IG-HA mouse (right) were killed at the day of diabetes onset or 7 d after diabetes onset, respectively. Pancreata were embedded in OCT and frozen; 5-μm sections were stained with insulin antibodies and revealed with AEC. Insulin (red staining) was clearly detected in recipients of 6.5hi anergic cells and not in recipients of 6.5hi naive cells (original magnification: 400).
Figure 4
Figure 4
Competitive RT-PCR for IL-10 mRNA expression in 6.5hi sorted splenocytes from TCR-HA and TCR-HA × IG-HA mice. IL-10 mRNA transcripts were compared between mice after standardization for the expression of the constitutively expressed HPRT gene (not shown). Constant amounts of cDNA samples were amplified in the presence of serial fourfold dilutions of a multispecific internal plasmid control (pQRS). PCR products were separated on 2% agarose gels and visualized by ethidium bromide staining under UV illumination, and photographed. Image densitometric analysis was performed using National Institutes of Health Image 1.61 software. The concentrations of competitor used are indicated on the top. In all cases, the upper band is due to amplification of the competitor construct and the lower band is due to amplification of the cDNA. The point of equivalence between the competitor and the cDNA indicates the relative concentration of mRNA (15.6 fg/ml). Similar results were obtained in two separate experiments for each group.
Figure 5
Figure 5
ELISPOT for IL-10. The frequency of 6.5hi sorted splenocytes from TCR-HA single transgenic and TCR-HA × IG-HA double transgenic mice that secreted IL-10 was determined. (A) Results are expressed as mean ± standard error spot-forming units per 1.1 × 10³ cells of duplicate determinations. (B) Representative alkaline phosphatase– based ELISPOT demonstrating IL-10 secretion by 6.5hi sorted splenocytes from TCR-HA × IG-HA sorted splenocytes. Similar results were obtained in two separate experiments.
Figure 5
Figure 5
ELISPOT for IL-10. The frequency of 6.5hi sorted splenocytes from TCR-HA single transgenic and TCR-HA × IG-HA double transgenic mice that secreted IL-10 was determined. (A) Results are expressed as mean ± standard error spot-forming units per 1.1 × 10³ cells of duplicate determinations. (B) Representative alkaline phosphatase– based ELISPOT demonstrating IL-10 secretion by 6.5hi sorted splenocytes from TCR-HA × IG-HA sorted splenocytes. Similar results were obtained in two separate experiments.

References

    1. Kisielow P, Bluthmann H, Staerz UD, Steinmetz M, von Boehmer H. Tolerance in T cell receptor transgenic mice involves deletion of nonmature CD4+8+thymocytes. Nature. 1988;333:742–746. - PubMed
    1. Kappler JW, Roehm N, Marrack P. T cell tolerance by clonal elimination in the thymus. Cell. 1987;49:273–280. - PubMed
    1. Rocha B, von Boehmer H. Peripheral selection of the T cell repertoire. Science. 1991;251:1225–1227. - PubMed
    1. Moskophidis D, Laine E, Zinkernagel RM. Peripheral clonal deletion of antiviral memory CD8+T cells. Eur J Immunol. 1993;23:3306–3311. - PubMed
    1. Kearney ER, Pape KA, Loh DY, Jenkins MK. Visualization of peptide-specific T cell immunity and peripheral tolerance induction in vivo. J Exp Med. 1994;1:327–339. - PubMed

MeSH terms