The type 1 receptor (CD120a) is the high-affinity receptor for soluble tumor necrosis factor
- PMID: 9435233
- PMCID: PMC18461
- DOI: 10.1073/pnas.95.2.570
The type 1 receptor (CD120a) is the high-affinity receptor for soluble tumor necrosis factor
Abstract
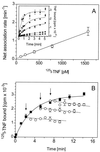
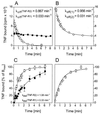
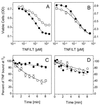
Tumor necrosis factor (TNF) can induce a variety of cellular responses at low picomolar concentrations. This is in apparent conflict with the published dissociation constants for TNF binding to TNF receptors in the order of 100-500 pM. To elucidate the mechanisms underlying the outstanding cellular sensitivity to TNF, we determined the binding characteristics of TNF to both human TNF receptors at 37 degrees C. Calculation of the dissociation constant (Kd) from the association and dissociation rate constants determined at 37 degrees C revealed a remarkable high affinity for TNF binding to the 60-kDa TNF type 1 receptor (TNF-R1; Kd = 1.9 x 10(-11) M) and a significantly lower affinity for the 80-kDa TNF type 2 receptor (TNF-R2; Kd = 4.2 x 10(-10) M). The high affinity determined for TNF-R1 is mainly caused by the marked stability of ligand-receptor complexes in contrast to the transient interaction of soluble TNF with TNF-R2. These data can readily explain the predominant role of TNF-R1 in induction of cellular responses by soluble TNF and suggest the stability of the TNF-TNF receptor complexes as a rationale for their differential signaling capability. In accordance with this reasoning, the lower signaling capability of homotrimeric lymphotoxin, compared with TNF, correlates with a lower stability of the lymphotoxin-TNF-R1 complex at 37 degrees C.
Figures


Similar articles
-
Fas-associated death domain protein and caspase-8 are not recruited to the tumor necrosis factor receptor 1 signaling complex during tumor necrosis factor-induced apoptosis.J Biol Chem. 2003 Jul 11;278(28):25534-41. doi: 10.1074/jbc.M303399200. Epub 2003 Apr 29. J Biol Chem. 2003. PMID: 12721308
-
Control of receptor-induced signaling complex formation by the kinetics of ligand/receptor interaction.J Biol Chem. 2002 Nov 15;277(46):44155-63. doi: 10.1074/jbc.M207399200. Epub 2002 Sep 4. J Biol Chem. 2002. PMID: 12215450
-
Neurodegenerative and neuroprotective effects of tumor Necrosis factor (TNF) in retinal ischemia: opposite roles of TNF receptor 1 and TNF receptor 2.J Neurosci. 2002 Apr 1;22(7):RC216. doi: 10.1523/JNEUROSCI.22-07-j0001.2002. Epub 2002 Mar 25. J Neurosci. 2002. PMID: 11917000 Free PMC article.
-
TNF-R1 signaling: a beautiful pathway.Science. 2002 May 31;296(5573):1634-5. doi: 10.1126/science.1071924. Science. 2002. PMID: 12040173 Review.
-
Death receptor activation complexes: it takes two to activate TNF receptor 1.Cell Cycle. 2003 Nov-Dec;2(6):550-2. Cell Cycle. 2003. PMID: 14504472 Review.
Cited by
-
Tumor necrosis factor-α: regulation of renal function and blood pressure.Am J Physiol Renal Physiol. 2013 May 15;304(10):F1231-42. doi: 10.1152/ajprenal.00557.2012. Epub 2013 Mar 20. Am J Physiol Renal Physiol. 2013. PMID: 23515717 Free PMC article. Review.
-
Characterization of concurrent target suppression by JNJ-61178104, a bispecific antibody against human tumor necrosis factor and interleukin-17A.MAbs. 2020 Jan-Dec;12(1):1770018. doi: 10.1080/19420862.2020.1770018. MAbs. 2020. PMID: 32544369 Free PMC article.
-
Transmembrane TNF and Its Receptors TNFR1 and TNFR2 in Mycobacterial Infections.Int J Mol Sci. 2021 May 22;22(11):5461. doi: 10.3390/ijms22115461. Int J Mol Sci. 2021. PMID: 34067256 Free PMC article. Review.
-
TNFα in MS and Its Animal Models: Implications for Chronic Pain in the Disease.Front Neurol. 2021 Dec 6;12:780876. doi: 10.3389/fneur.2021.780876. eCollection 2021. Front Neurol. 2021. PMID: 34938263 Free PMC article. Review.
-
A trifluoromethyl analogue of celecoxib exerts beneficial effects in neuroinflammation.PLoS One. 2013 Dec 11;8(12):e83119. doi: 10.1371/journal.pone.0083119. eCollection 2013. PLoS One. 2013. PMID: 24349442 Free PMC article.
References
-
- Damas P, Reuter A, Gysen P, Demonty J, Lamy M, Franchimont P. Crit Care Med. 1989;17:975–978. - PubMed
-
- Tracey K J, Cerami A. Annu Rev Cell Biol. 1993;9:317–343. - PubMed
-
- Coffman F D, Green L M, Ware C F. Lymphokine Res. 1988;7:371–383. - PubMed
-
- Meager A, Sampson L E, Grell M, Scheurich P. Cytokine. 1993;5:556–563. - PubMed
-
- Chan H, Aggarwal B B. J Biol Chem. 1994;269:31424–31429. - PubMed
Publication types
MeSH terms
Substances
LinkOut - more resources
Full Text Sources
Other Literature Sources
Molecular Biology Databases

