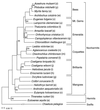
Slow rate of molecular evolution in high-elevation hummingbirds
- PMID: 9435240
- PMCID: PMC18468
- DOI: 10.1073/pnas.95.2.612
Slow rate of molecular evolution in high-elevation hummingbirds
Abstract
Estimates of relative rates of molecular evolution from a DNA-hybridization phylogeny for 26 hummingbird species provide evidence for a negative association between elevation and rate of single-copy genome evolution. This effect of elevation on rate remains significant even after taking into account a significant negative association between body mass and molecular rate. Population-level processes do not appear to account for these patterns because (i) all hummingbirds breed within their first year and (ii) the more extensive subdivision and speciation of bird populations living at high elevations predicts a positive association between elevation and rate. The negative association between body mass and molecular rate in other organisms has been attributed to higher mutation rates in forms with higher oxidative metabolism. As ambient oxygen tensions and temperature decrease with elevation, the slow rate of molecular evolution in high-elevation hummingbirds also may have a metabolic basis. A slower rate of single-copy DNA change at higher elevations suggests that the dynamics of molecular evolution cannot be separated from the environmental context.
Figures


Similar articles
-
Molecular phylogenetics and the diversification of hummingbirds.Curr Biol. 2014 Apr 14;24(8):910-6. doi: 10.1016/j.cub.2014.03.016. Epub 2014 Apr 3. Curr Biol. 2014. PMID: 24704078
-
Resolution of a paradox: hummingbird flight at high elevation does not come without a cost.Proc Natl Acad Sci U S A. 2004 Dec 21;101(51):17731-6. doi: 10.1073/pnas.0405260101. Epub 2004 Dec 14. Proc Natl Acad Sci U S A. 2004. PMID: 15598748 Free PMC article.
-
Parallel Molecular Evolution in Pathways, Genes, and Sites in High-Elevation Hummingbirds Revealed by Comparative Transcriptomics.Genome Biol Evol. 2019 Jun 1;11(6):1552-1572. doi: 10.1093/gbe/evz101. Genome Biol Evol. 2019. PMID: 31114863 Free PMC article.
-
Parasite specialization in a unique habitat: hummingbirds as reservoirs of generalist blood parasites of Andean birds.J Anim Ecol. 2016 Sep;85(5):1234-45. doi: 10.1111/1365-2656.12550. Epub 2016 Jun 9. J Anim Ecol. 2016. PMID: 27177277
-
Patterns and drivers of intraspecific variation in avian life history along elevational gradients: a meta-analysis.Biol Rev Camb Philos Soc. 2016 May;91(2):469-82. doi: 10.1111/brv.12180. Epub 2015 Mar 12. Biol Rev Camb Philos Soc. 2016. PMID: 25765584 Review.
Cited by
-
The rate of DNA evolution: effects of body size and temperature on the molecular clock.Proc Natl Acad Sci U S A. 2005 Jan 4;102(1):140-5. doi: 10.1073/pnas.0407735101. Epub 2004 Dec 23. Proc Natl Acad Sci U S A. 2005. PMID: 15618408 Free PMC article.
-
The road from Santa Rosalia: a faster tempo of evolution in tropical climates.Proc Natl Acad Sci U S A. 2006 May 16;103(20):7718-22. doi: 10.1073/pnas.0510383103. Epub 2006 May 3. Proc Natl Acad Sci U S A. 2006. PMID: 16672371 Free PMC article.
-
Morphology and niche evolution influence hummingbird speciation rates.Proc Biol Sci. 2023 Apr 26;290(1997):20221793. doi: 10.1098/rspb.2022.1793. Epub 2023 Apr 19. Proc Biol Sci. 2023. PMID: 37072043 Free PMC article.
-
Reconstruction and function of ancestral center-of-tree human immunodeficiency virus type 1 proteins.J Virol. 2007 Aug;81(16):8507-14. doi: 10.1128/JVI.02683-06. Epub 2007 May 30. J Virol. 2007. PMID: 17537854 Free PMC article.
-
Latitude, elevation and the tempo of molecular evolution in mammals.Proc Biol Sci. 2009 Sep 22;276(1671):3353-9. doi: 10.1098/rspb.2009.0674. Epub 2009 Jun 25. Proc Biol Sci. 2009. PMID: 19556254 Free PMC article.
References
-
- Britten R J. Science. 1986;231:1393–1398. - PubMed
-
- Easteal S, Collet C, Betty D. The Mammalian Molecular Clock. Austin, TX: R. D. Landes; 1995.
-
- Rand D M. Trends Ecol Evol. 1994;9:125–130. - PubMed
-
- Barraclough T G, Harvey P H, Nee S. Proc R Soc London B Biol Sci. 1996;263:589–591.
-
- Martin A P, Naylor G J P, Palumbi S R. Nature (London) 1992;357:153–155. - PubMed
MeSH terms
Substances
LinkOut - more resources
Full Text Sources
Research Materials

