. 1998 Jan 20;95(2):646-51.
doi: 10.1073/pnas.95.2.646.

Mutations in the MRE11, RAD50, XRS2, and MRE2 genes alter chromatin configuration at meiotic DNA double-stranded break sites in premeiotic and meiotic cells

Affiliations

Mutations in the MRE11, RAD50, XRS2, and MRE2 genes alter chromatin configuration at meiotic DNA double-stranded break sites in premeiotic and meiotic cells

K Ohta et al. Proc Natl Acad Sci U S A. .

Abstract

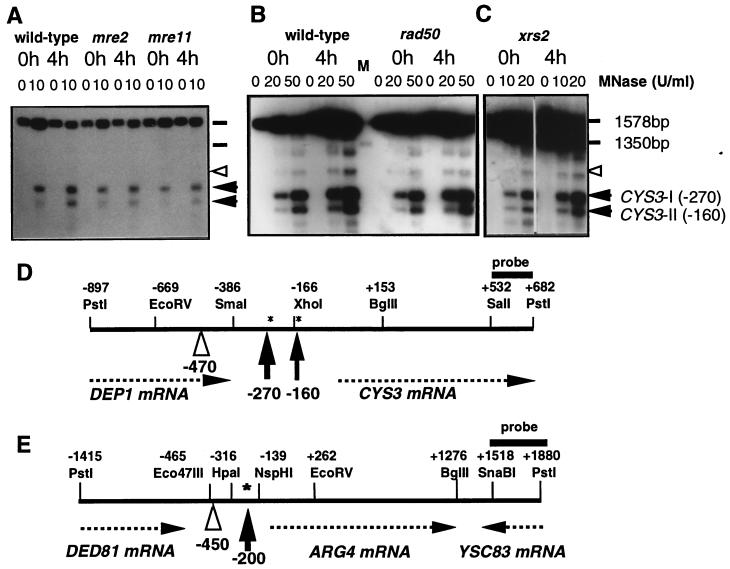
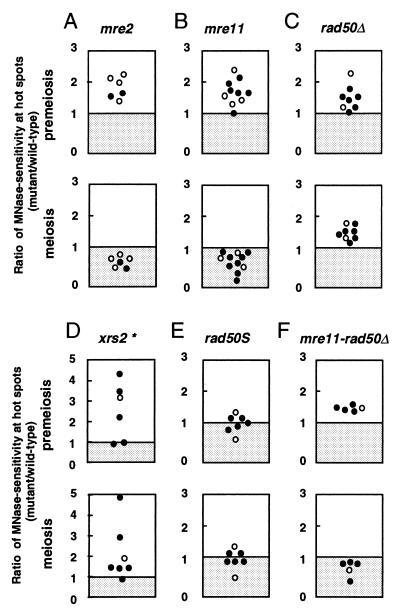
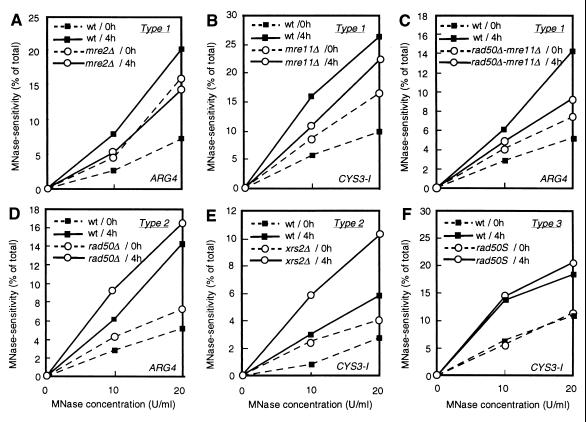
In the yeast Saccharomyces cerevisiae, meiotic recombination is initiated by DNA double-stranded breaks (DSBs) occurring in micrococcal nuclease (MNase)-hypersensitive regions of the chromatin. MNase-sensitive sites also undergo meiosis-specific alterations in chromatin structure prior to the appearance of DSBs. DSB formation requires the products of numerous genes. Herein we have examined the effects of mutations in four such genes, MRE11, RAD50, XRS2, and MRE2, on MNase sensitivity at DSB sites in premeiotic and meiotic cells. Disruption mutations in each of four genes confer greater than wild-type levels of MNase sensitivity in premeiotic cells. In meiotic prophase, all of these mutations affect MNase sensitivity at DSB sites and fall into two distinct phenotypic classes. The type 1 mutations (mre2 and mre11) confer a reduction in MNase sensitivity relative to the wild-type level. The type 2 mutations (rad50 and xrs2) permit a meiotic increase in the MNase sensitivity to reach a final level higher than that observed in wild-type cells. An mre11 disruption mutation (type 1) is epistatic to a rad50 null mutation (type 2) with respect to its meiotic effects on MNase sensitivity, suggesting that the events observed in the type 2 mutants during meiosis are dependent upon type 1 functions. One interpretation of these results is that Mre11, Rad50, Xrs2, and possibly Mer2 (whose splicing is Mre2-dependent) form a complex at recombination hot spots and establish a chromatin/DNA configuration favorable for the induction of DSBs.


Figures

Figure 1
Figure 1
(A–C) Changes in MNase hypersensitivity at the CYS3 hot spot in wild-type and DSB-deficient mutant strains (A, mre2URA3, mre11URA3; B, rad50Δ; C, xrs2URA3). DNA in chromatin from cells cultured in SPM for 0 h (lanes 0h) and 4 h (lanes 4h) was treated with MNase at 0, 10, 20 (0, 20, and 50 for rad50Δ) units/ml. PstI-digested DNA was separated on a 1.5% agarose gel and examined by Southern blot hybridization using a CYS3 PstI–SalI probe. The positions of the two hypersensitive sites at the CYS3 hot spot are shown by arrowheads. A site serving as an internal standard (a noninducible and non-DSB site) is indicated by an open arrowhead. Molecular size standards are indicated with horizontal bars. (D and E) Diagrams of the CYS3 (D) and ARG4 (E) loci. Positions for restriction sites, MNase-hypersensitive sites (shown by vertical arrows), and control MNase-sensitive sites (open arrowheads) for internal standards are indicated relative to position +1, the first base of the CYS3 or ARG4 coding region. Asterisks show the positions of meiotic DSBs. Horizontal arrows represent the orientation of the transcripts indicated. Probes used in the present study are shown by horizontal thick bars.
Figure 2
Figure 2
Ratio of mutant MNase sensitivity to that of the wild-type control. Each mutant was analyzed in several experiments using various concentrations (7, 10, and 20 units/ml) of MNase. In each experiment, two or three mutant cultures were analyzed in parallel with a wild-type control culture on the same day. Ratio of mutant MNase sensitivity to wild-type sensitivity at ARG4 (○) and CYS3 (•) DSB sites were plotted. Only vertical axes (ratio of mutant to wild type) are meaningful. (A) mre2. (B) mre11. (C) rad50Δ. (D) xrs2. (E) rad50S. (F) mre11-rad50Δ. (Upper) Premeiotic data. (Lower) Meiotic data. The experimental variation in the xrs2 data (marked by the asterisk) probably reflects subtle differences in procedures as performed by different experimenters.
Figure 3
Figure 3
Quantitative comparison of MNase hypersensitivity. MNase hypersensitivity (expressed as percentage of total lane intensity) at ARG4 (A, C, and D) and CYS3 site I (B, E, and F) in mre2 (A), mre11 (B), mre11 rad50Δ (C), rad50Δ (D), xrs2 (E), and rad50S (F) is plotted as a function of MNase concentration. The mutant and wild-type cultures were always analyzed in parallel on the same day. For an accurate evaluation of the mutant phenotypes, all mutant data are indicated with wild-type data for an internal standard taken on the same day. Solid symbols, wild type; open symbols, mutants. Dashed lines, 0 h (premeiosis); solid lines, 4 h (meiosis). Note that the mutants are classified into groups (types 1, type 2, and rad50S, as indicated) and that the mutant effects are independent of the MNase concentration.

Similar articles

Cited by

References

    1. Nicolas A, Treco D, Schultes N P, Szostak J W. Nature (London) 1989;338:35–39. - PubMed
    1. Sun H, Treco D, Schultes N P, Szostak J W. Nature (London) 1989;338:87–90. - PubMed
    1. Cao L, Alani E, Kleckner N. Cell. 1990;61:1089–1101. - PubMed
    1. Schultes N P, Szostak J W. Mol Cell Biol. 1991;11:322–328. - PMC - PubMed
    1. White M A, Detloff P, Strand M, Petes T D. Curr Genet. 1992;21:109–116. - PubMed

Publication types