. 1998 Jan 15;12(2):149-62.
doi: 10.1101/gad.12.2.149.

Cellular and developmental control of O2 homeostasis by hypoxia-inducible factor 1 alpha

Affiliations

Cellular and developmental control of O2 homeostasis by hypoxia-inducible factor 1 alpha

N V Iyer et al. Genes Dev. .

Abstract

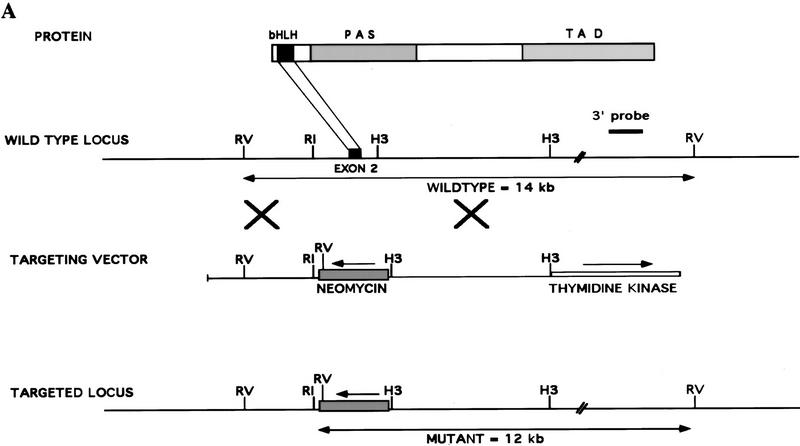
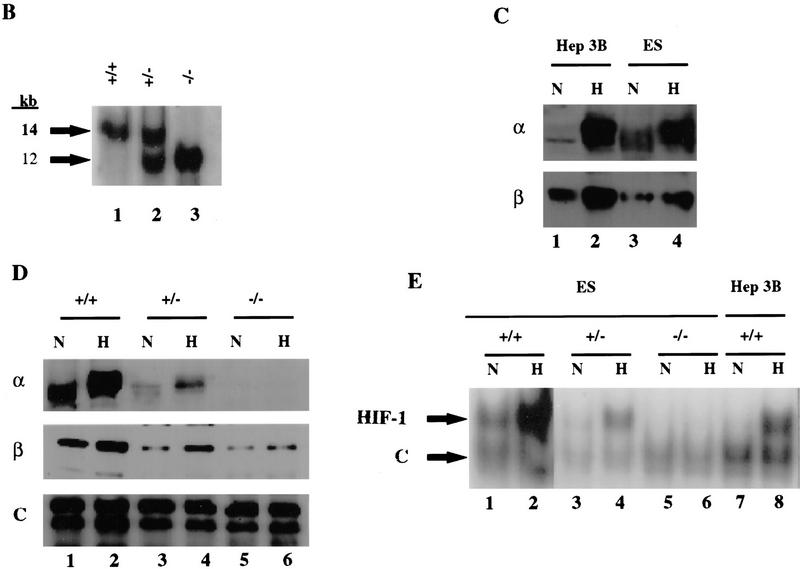
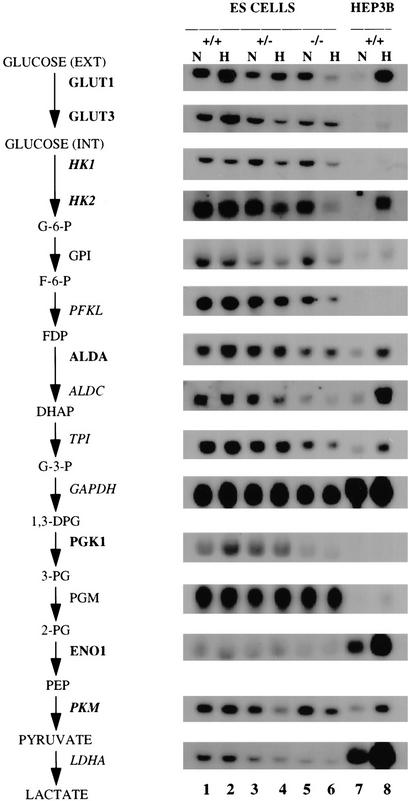
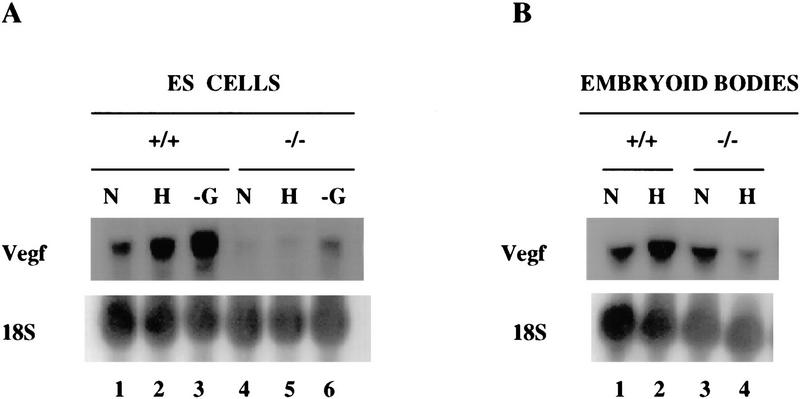
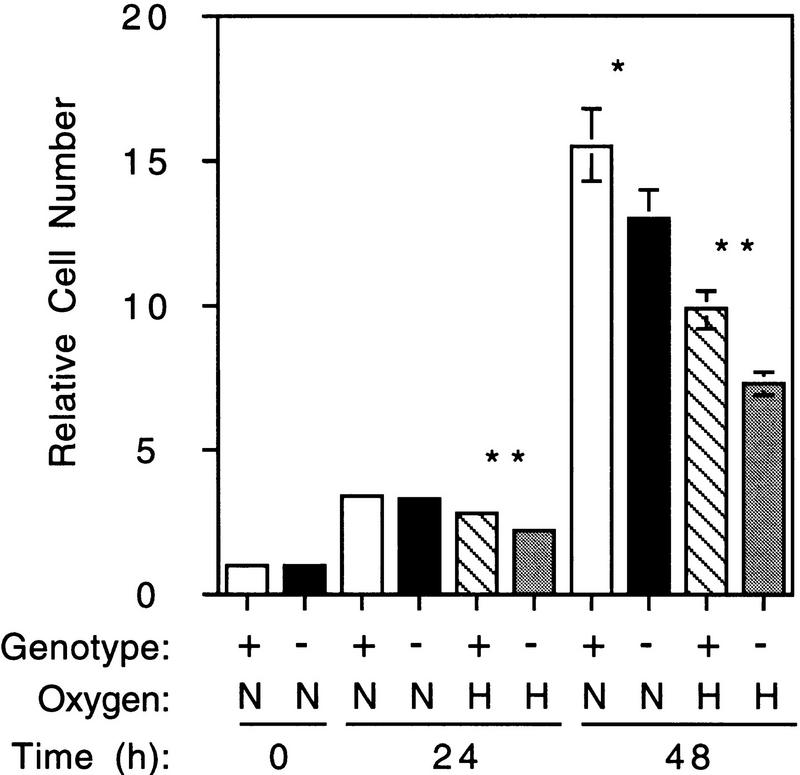
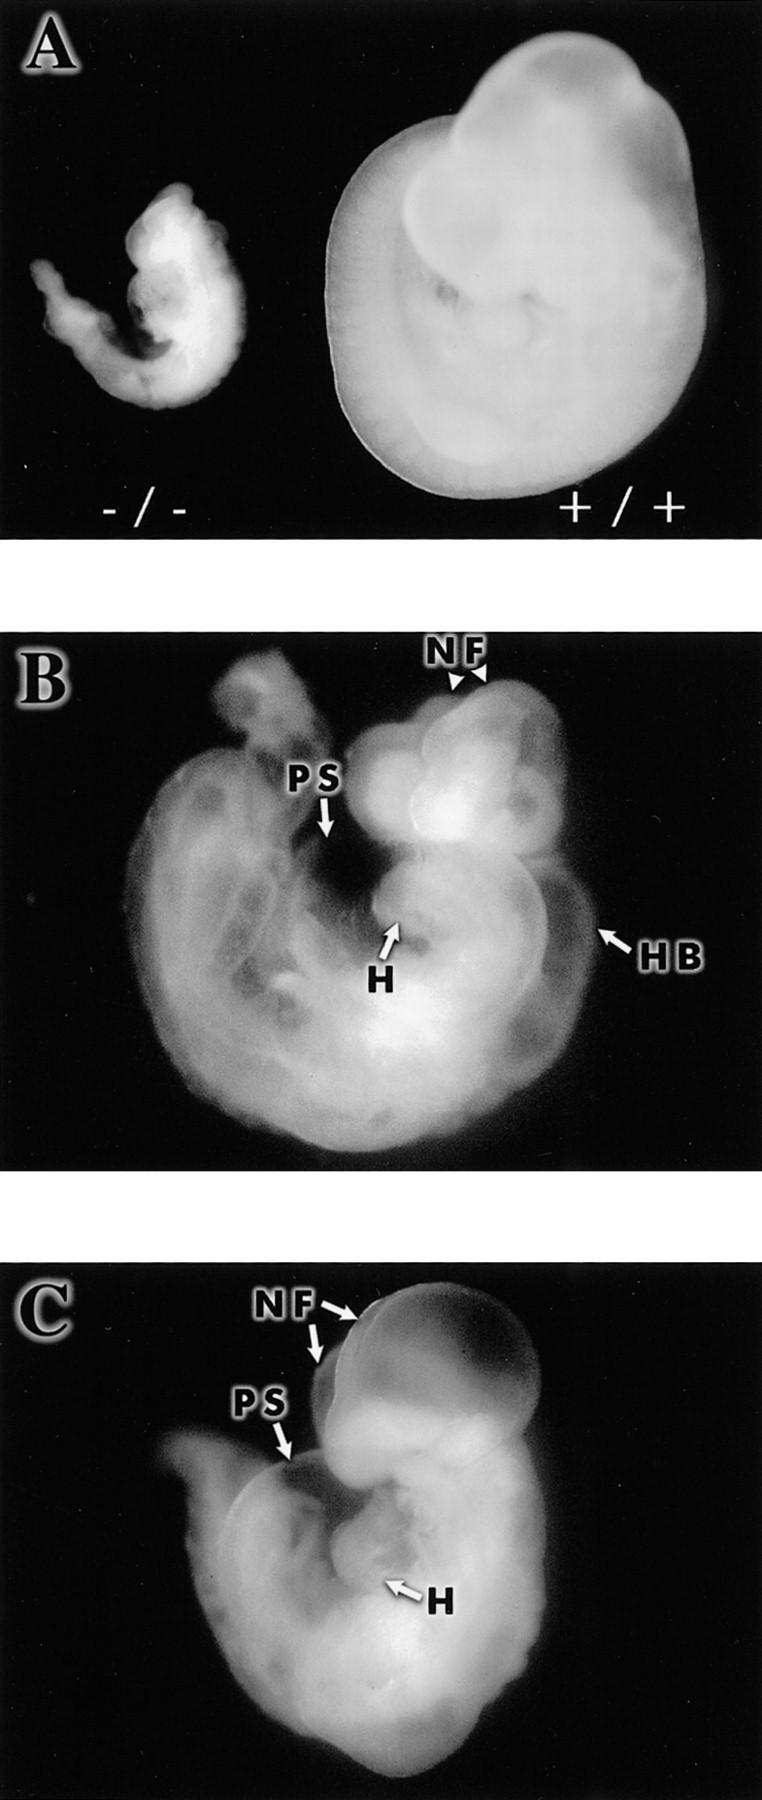
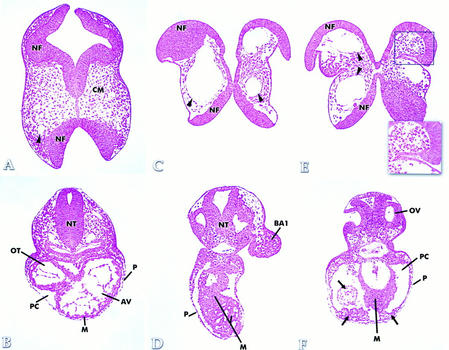
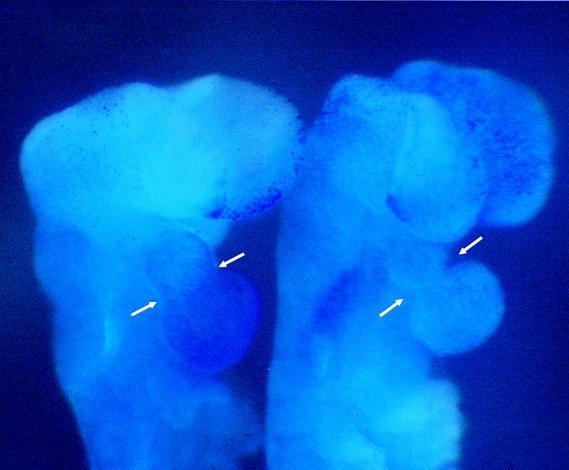
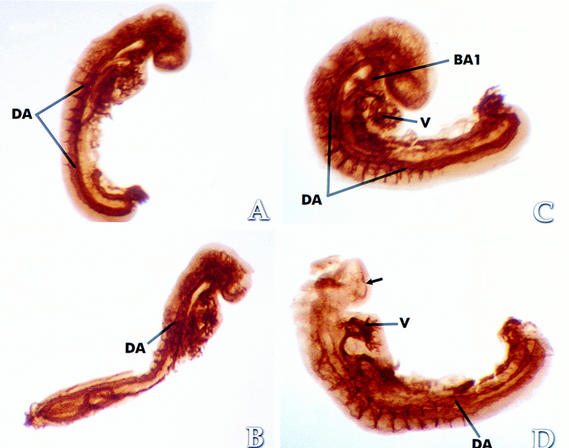
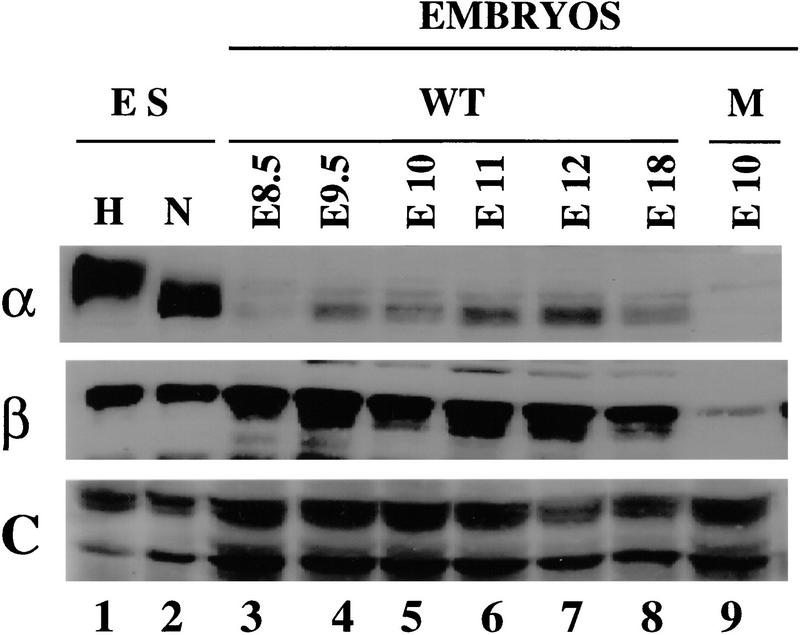
Hypoxia is an essential developmental and physiological stimulus that plays a key role in the pathophysiology of cancer, heart attack, stroke, and other major causes of mortality. Hypoxia-inducible factor 1 (HIF-1) is the only known mammalian transcription factor expressed uniquely in response to physiologically relevant levels of hypoxia. We now report that in Hif1a-/- embryonic stem cells that did not express the O2-regulated HIF-1alpha subunit, levels of mRNAs encoding glucose transporters and glycolytic enzymes were reduced, and cellular proliferation was impaired. Vascular endothelial growth factor mRNA expression was also markedly decreased in hypoxic Hif1a-/- embryonic stem cells and cystic embryoid bodies. Complete deficiency of HIF-1alpha resulted in developmental arrest and lethality by E11 of Hif1a-/- embryos that manifested neural tube defects, cardiovascular malformations, and marked cell death within the cephalic mesenchyme. In Hif1a+/+ embryos, HIF-1alpha expression increased between E8.5 and E9.5, coincident with the onset of developmental defects and cell death in Hif1a-/- embryos. These results demonstrate that HIF-1alpha is a master regulator of cellular and developmental O2 homeostasis.


Figures

Figure 1
Figure 1
Targeted disruption of the Hif1a gene by homologous recombination in ES cells. (A) Structure of HIF-1α protein, wild-type Hif1a locus, targeting vector, and targeted Hif1a locus. Important functional domains in the protein are the bHLH and PAS domains, which are required for dimerization and DNA binding, and the transactivation domains (TAD). Homologous recombination (large crosses) results in replacement of exon 2 with a neomycin resistance gene in the opposite transcriptional orientation (arrow). Targeted clones are G418 and gancyclovir resistant owing to the presence of the neomycin-resistance gene and the absence of the thymidine kinase gene. (B) DNA blot hybridization analysis of ES cell clones. The wild-type and targeted loci are identified by the presence of 14- and 12-kb EcoRV restriction fragments, respectively, that are detected by the 3′ probe shown in A. (C) HIF-1 immunoblot analysis of Hep3B and ES cells. Nuclear extracts were prepared from cells cultured under nonhypoxic (N) (20% O2) or hypoxic (H) (1% O2) conditions for 4 hr. Immunoblot assays were performed using affinity-purified antibodies specific for HIF-1α (top) or HIF-1β (bottom). (D) Immunoblot analysis of HIF-1 expression in Hif1a+/+, Hif1a+/-, and Hif1a−/− ES cells. Nuclear extracts were prepared from cells cultured under nonhypoxic (N) or hypoxic (H) conditions for 4 hr. Immunoblot assays were performed using antibodies specific for HIF-1α (top), HIF-1β (middle), or a control (C) protein, topoisomerase I (bottom). (E) Electrophoretic mobility-shift assay of HIF-1 DNA-binding activity. Nuclear extracts from ES and Hep3B cells were incubated with a double-stranded oligonucleotide probe containing an 18-bp EPO gene sequence. Binding of HIF-1 and a constitutively expressed factor (C) is indicated.
Figure 1
Figure 1
Targeted disruption of the Hif1a gene by homologous recombination in ES cells. (A) Structure of HIF-1α protein, wild-type Hif1a locus, targeting vector, and targeted Hif1a locus. Important functional domains in the protein are the bHLH and PAS domains, which are required for dimerization and DNA binding, and the transactivation domains (TAD). Homologous recombination (large crosses) results in replacement of exon 2 with a neomycin resistance gene in the opposite transcriptional orientation (arrow). Targeted clones are G418 and gancyclovir resistant owing to the presence of the neomycin-resistance gene and the absence of the thymidine kinase gene. (B) DNA blot hybridization analysis of ES cell clones. The wild-type and targeted loci are identified by the presence of 14- and 12-kb EcoRV restriction fragments, respectively, that are detected by the 3′ probe shown in A. (C) HIF-1 immunoblot analysis of Hep3B and ES cells. Nuclear extracts were prepared from cells cultured under nonhypoxic (N) (20% O2) or hypoxic (H) (1% O2) conditions for 4 hr. Immunoblot assays were performed using affinity-purified antibodies specific for HIF-1α (top) or HIF-1β (bottom). (D) Immunoblot analysis of HIF-1 expression in Hif1a+/+, Hif1a+/-, and Hif1a−/− ES cells. Nuclear extracts were prepared from cells cultured under nonhypoxic (N) or hypoxic (H) conditions for 4 hr. Immunoblot assays were performed using antibodies specific for HIF-1α (top), HIF-1β (middle), or a control (C) protein, topoisomerase I (bottom). (E) Electrophoretic mobility-shift assay of HIF-1 DNA-binding activity. Nuclear extracts from ES and Hep3B cells were incubated with a double-stranded oligonucleotide probe containing an 18-bp EPO gene sequence. Binding of HIF-1 and a constitutively expressed factor (C) is indicated.
Figure 2
Figure 2
Expression of genes encoding glucose transporters and glycolytic enzymes. The glycolytic pathway is shown at left. Symbols for genes encoding the respective enzymes are coded by font according to the mRNA expression pattern (normalized to 18S rRNA) in ES cells cultured under nonhypoxic (N) or hypoxic (H) conditions for 16 hr (lanes 1–6 at right) as follows: (1) (bold) increased expression in hypoxic Hif1a+/+ cells, loss of induction in Hif1a+/− cells, and loss of basal and induced expression in Hif1a−/− cells; (2) (bold and italicized) no effect of hypoxia on expression in Hif1a+/+ cells but decreased expression in hypoxic Hif1a+/− and Hif1a−/− cells; (3) (italicized) no effect of hypoxia on expression in Hif1a+/+ cells but decreased expression in hypoxic and nonhypoxic Hif1a−/− cells; (4) (plain) no effect of hypoxia or HIF-1α deficiency on expression. mRNA expression in Hep3B cells was also assayed (lanes 7,8). The indicated genes encode the following proteins: (GLUT1 and GLUT3) glucose transporter 1 and 3; (HK1 and HK2) hexokinase 1 and 2; (GPI) glucosephosphate isomerase; (PFKL) phosphofructokinase L; (ALDA and ALDC) aldolase A and C; (TPI) triosephosphate isomerase; (GAPDH) glyceraldehyde-3-phosphate dehydrogenase; (PGK1) phosphoglycerate kinase 1; (PGM) phosphoglucomutase; (ENO1) enolase 1; (PKM) pyruvate kinase M; (LDHA) lactate dehydrogenase A. GLUCOSE (EXT) and GLUCOSE (INT) refer to extracellular and intracellular glucose, respectively.
Figure 3
Figure 3
Expression of VEGF mRNA in ES cells and cystic embryoid bodies. (A) ES cells. Hif1a+/+ and Hif1a−/− cells were incubated in complete medium at 20% O2 (N), complete medium at 1% O2 (H), or glucose-deficient medium at 20% O2 (−G) for 16 hr. Total RNA was isolated and analyzed by blot hybridization with 32P-labeled VEGF cDNA (top) and 18S rRNA oligonucleotide (bottom) probes. (B) Embryoid bodies. ES cells were cultured for 4 days in methylcellulose to induce differentiation and then exposed to 20% (N) or 0% (H) O2 for 16 hr prior to RNA isolation and blot hybridization as described above.
Figure 4
Figure 4
Growth of ES cells under nonhypoxic and hypoxic culture conditions. Hif1a+/+ (+) or Hif1a−/− (−) cells (6 × 105) were plated per 10-cm dish. After 24 hr, one plate of each genotype was removed for cell counting (0 hr). The remaining plates were cultured under nonhypoxic (N; 20% O2) or hypoxic (H; 1% O2) conditions. The medium was changed after 24 hr and, for each condition, three plates each were removed after 24 or 48 hr for cell counts, which were normalized to the 0-hr cell count. Four fields were counted from each plate, and the experiment was performed three times. The mean (n = 36) and s.d. (bar) for each experimental condition were calculated, and results for Hif1a−/− cells that were significantly different from Hif1a+/+ cells are indicated: (*) P < 0.05; (**) P < 0.01 (Student’s t-test).
Figure 5
Figure 5
Abnormal development of Hif1a−/− embryos. (A) Comparison of viable Hif1a−/− and Hif1a+/+ embryos at E10.0. (B) Prolapsed neural folds (NF), cystic enlargement of the hindbrain (HB), and pericardial effusion in an E9.75 Hif1a−/− embryo. (H) Heart; (PS) pericardial sac. (C) Cystic appearance of cephalic region and pericardial effusion in an E9.75 Hif1a−/− embryo.
Figure 6
Figure 6
Histologic analysis. Sections through the cranial region of stage-matched Hif1a+/+ (A) and E9.75–E10.0 Hif1a−/− (C,E) embryos are shown. A normal blood vessel (arrowhead in A) can be compared with the anomalous vascular structures contained within the cephalic mesenchyme (arrowheads in C and E) of Hif1a−/− embryos, which also manifest prolapsed neural folds (NF) and a deficiency of cranial mesenchyme (CM) relative to the Hif1a+/+ embryo. Sections through the cardiac region of stage-matched Hif1a+/+ (B) and E9.75–E10.0 Hif1a−/− (D,F) embryos are shown. Hyperplasia of presumptive myocardium (M) and anomalous tissue (arrows in F) are evident within the enlarged pericardial cavity (PC) and along the pericardium (P). (AV) Atrioventricular canal; (BA1) first branchial arch; (NT) neural tube; (OV) otic vesicle; (OT) ventricular outflow tract.
Figure 7
Figure 7
Supravital dye staining. Ten-somite Hif1a+/+ (left) and Hif1a−/− (right) embryos have been treated with Nile blue sulfate. Punctate staining indicative of cell death is apparent within the mesenchymal compartment of the fore- and midbrain region in the left neural fold of the Hif1a−/− embryo and is absent in the corresponding region of the Hif1a+/+ embryo. Nonspecific trapping of dye in the heart lumen also allowed analysis of cardiac morphogenesis. Arrows over the embryos have been placed the same distance apart to demonstrate the constriction between ventricle and outflow tract of the Hif1a−/− embryo. The Hif1a−/− heart is not stained, suggesting absence of a patent lumen.
Figure 8
Figure 8
PECAM immunohistochemistry. Comparison of E8.5–E8.75 Hif1a+/+ (A) and Hif1a−/− (B) embryos reveals no apparent differences in vascularization. In contrast, the vascularization of the E9.25 Hif1a−/− embryo (D) is markedly abnormal when compared with a stage-matched Hif1a+/+ embryo (C). Anomalous endothelial-lined vascular structures are present in the cranial region (arrow in D), no branchial arch vessels have formed, the lumen of the heart tube is not apparent, and the diameter of the dorsal aorta (DA) is irregular. (BA1) First branchial arch; (V) Ventricle.
Figure 9
Figure 9
Immunoblot analysis of HIF-1 expression in Hif1a+/+ and Hif1a−/− embryos. Aliquots (15 μg) of nuclear extracts from nonhypoxic (N) and hypoxic (H) Hif1a+/+ ES cells (lanes 1,2) and aliquots (120 μg) of lysates prepared from Hif1a+/+ (WT; lanes 3–8) and Hif1a−/− (M; lane 9) embryos of the indicated gestational age were analyzed using antibodies specific for HIF-1α (top), HIF-1β (middle), or as a control (C), topoisomerase I (bottom).

References

    1. Andersen B, Rosenfeld MG. Pit-1 determines cell types during development of the anterior pituitary gland: A model for transcriptional regulation of cell phenotypes in mammalian organogenesis. J Biol Chem. 1994;269:29335–29338. - PubMed
    1. Ausubel FM, Brent R, Kingston RE, Moore DD, Seidman JG, Smith JA, Struhl K, Albright LM, Coen D, Varki MA, Janssen K. Current protocols in molecular biology. New York, NY: John Wiley and Sons; 1994.
    1. Benjamin LE, Keshet E. Conditional switching of vascular endothelial growth factor (VEGF) expression in tumors: Induction of endothelial cell shedding and regression of hemangioblastoma-like vessels by VEGF withdrawal. Proc Natl Acad Sci. 1997;94:8761–8766. - PMC - PubMed
    1. Bradley A. Production and analysis of chimaeric mice. In: Robertson EJ, editor. Teratocarcinomas and embryonic stem cells: A practical approach. 1st ed. Oxford, UK: IRL Press; 1987. pp. 113–152.
    1. Carmeliet P, Ferreira V, Breier G, Pollefeyt S, Kieckens L, Gertesenstein M, Fahrig M, Vandenhoeck A, Harpal K, Eberhardt C, Declercq C, Pawling J, Moons L, Collen D, Risau W, Nagy A. Abnormal blood vessel development and lethality in embryos lacking a single VEGF allele. Nature. 1996;380:435–439. - PubMed

Publication types

MeSH terms