. 1998 Feb 1;18(3):821-9.
doi: 10.1523/JNEUROSCI.18-03-00821.1998.

Transport and turnover of microtubules in frog neurons depend on the pattern of axonal growth

Affiliations

Transport and turnover of microtubules in frog neurons depend on the pattern of axonal growth

S Chang et al. J Neurosci. .

Abstract

The transport of axonal microtubules in growing neurites has been a controversial issue because of clear but conflicting results obtained with fluorescence-marking techniques. We have attempted to resolve the discordance via analysis of the relationship between apparent microtubule translocation and cell adhesion. Neuronal cultures were prepared from Xenopus embryos 1 d after injection of Cy3-conjugated tubulin into one of the blastomeres of two-cell-stage embryos. Anterograde translocation of axonal microtubules was observed in neurons cultured on a laminin-coated surface, in agreement with previously published data for Xenopus embryonic neurons. However, when neuronal cultures were prepared on a concanavalin A-treated surface, the axonal microtubules were stationary, as reported for all other neurons investigated previously. Neuronal cultures prepared on laminin- and concanavalin A-coated surfaces also demonstrated dramatic differences in the pattern of axonal growth, dynamics of axonal microtubules, and response to brefeldin A treatment. Our findings suggest that transport and dynamics of axonal microtubules may be directly affected by the mechanical tension produced by growth cone activity.


Figures
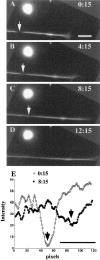
Fig. 1.
Fig. 1.
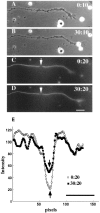
Anterograde movement of photobleached MTs in an elongating Xenopus neurite growing on laminin-coated substrate. A–D, Fluorescent images of a neurite captured after photobleaching. The photobleaching was performed 16 hr after cell culture preparation. The bleached segment was at the distal (near the growth cone) axonal segment. Numbers indicate the time in minutes and seconds after the photobleaching pulse. The position of the center of the bleached zone is indicated byarrows. The photobleached zone remained visible for ∼6 min. Forward movement of the photobleached zone was clearly visible during the first few minutes after photobleaching. The rate of bleached zone movement was ∼48 μm/hr, and the rate of growth cone advance was ∼85 μm/hr. E, Fluorescence intensity profiles of an axonal segment including the photobleached segment created from images A (15 sec after photobleaching, open circles) and C (8 min and 15 sec after photobleaching, filled squares). Thebottom of the fluorescence intensity profile (arrows) moved toward the distal end of the neurite. Scale bars, 10 μm.
Fig. 2.
Fig. 2.
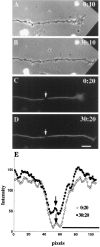
MTs remain stationary during axonal growth on Con A-coated substrate. A–D, Phase contrast (A, B) and fluorescent (C,D) images of a neurite 12 hr after cell culture preparation. The time after photobleaching is indicated in minutes and seconds in the top right corner of each panel. The bleached zone was clearly visible during the experiment (30 min). No obvious change in the position of the bleached segment was observed. The neurite continued to grow and extended by ∼20 μm.E, Fluorescence intensity profiles of an axonal segment including the photobleached segment created from imagesC (20 sec after photobleaching, open circles) and D (30 min and 20 sec after photobleaching, filled squares). Thebottom of the fluorescence intensity profile (arrows) remained stationary within experimental error (∼1 μm). Scale bars, 10 μm.
Fig. 3.
Fig. 3.
MTs remain stationary in rapidly growing neurites plated on a Con A-coated surface in the presence of neurotrophic factors. A–D, Phase contrast (A,B) and fluorescent (C, D) images of a neurite growing in the presence of neurotrophic factors NT-3, BDNF, and CNTF (50 ng/ml each) in the culture medium. The photobleaching was performed 18 hr after cell culture preparation. The time after photobleaching is indicated in minutes and seconds in thetop right corner of each panel. The length of the neurite was ∼900 μm, and the rate of axonal growth was ∼57 μm/hr. The photobleached zone was clearly visible during the experiment (30 min) and remained stationary within experimental error (∼1 μm) (arrows in C and D).E, Fluorescence intensity profiles of an axonal segment including the pho-tobleached segment created from images C (20 sec after photobleaching, open circles) and D (30 min and 20 sec after photobleaching, filled squares). Thebottom of the fluorescence intensity profile (arrows) remained stationary within experimental error (∼1 μm). Scale bars, 10 μm.
Fig. 4.
Fig. 4.
Quantitative assessment of the movement of bleached zones. The rate of the movement of the center of the bleached zone relative to the substrate is plotted as a function of neurite elongation rate. A, Neurites growing on laminin-coated substrate. The average rate of neurite extension was 59 ± 7 μm/hr (mean ± SEM; n = 18). The bleached zone was located at the distal axonal segment (open circles) and at the proximal segment (filled squares) in 11 and 7 experiments, respectively. The average rate of bleached zone movement was 32 ± 5 μm/hr (mean ± SEM). In each experiment, the accuracy of the measurements of the positions of growth cone and bleached zone was ∼1 μm. Detection of the MT translocation rate was more accurate for neurites with relatively stable MTs (slow fluorescence recovery). Generally the bleached zone could be reliably traced for a period of 10–20 min, and therefore the accuracy of the measurements was ∼3–6 μm/hr. In seven experiments, we were not able to measure reliably the rate of bleached zone movement. In two of these seven cases, the bleached zone was visible only for a few minutes (t½ of ∼3 min), precluding accurate measurements of the MT movement. In the remaining five cases, the lateral movement of the whole axonal structure was very fast, and the measurements of the bleached zone position were meaningless. Results of these seven experiments have been excluded from the analysis of MT movement. B, Neurites growing on Con A-coated substrate; summary of 25 different experiments. In five experiments (filled triangles), neurotrophic factors NT-3, BDNF, and CNTF (50 ng/ml each) were added to the culture medium during cell culture preparation and were present throughout the experiment. No neurotrophic factors were added to the culture medium in the remaining 20 experiments (open circles). The bleached zone was at the distal axonal segment in 18 experiments and at the proximal segment in seven experiments. In the absence of NT-3 in the culture medium, the average rate of axonal growth and the rate of bleached zone movement were 25.6 ± 3.7 and −0.4 ± 0.5 μm/hr, respectively (mean ± SEM; n = 20). In the presence of NT-3, the rates of axonal growth and the bleached zone movement were 55 ± 8 and 1.4 ± 1.2 μm/hr, respectively (mean ± SEM; n = 5). The position of the bleached zone could be measured with an accuracy of ∼1 μm. Typically the movement of the bleached zone was followed for 30–60 min. Therefore we estimate the accuracy of the measurements of the MT movement rate to be ∼1–2 μm/hr.
Fig. 5.
Fig. 5.
Quantitative analysis of the fluorescence recovery in the bleached zones. Experiments were performed as described in Figures 1-3. The bleached zones were at the proximal (black bars) or distal (hatched bars) axonal segments. In each experiment, the average time for 50% recovery of fluorescence (t½) was calculated. For neuronal cultures growing on either laminin- or Con A-coated substrate,t½ values were significantly higher at the proximal segments compared with the distal segments. Recovery of fluorescence was approximately fivefold faster (smallert½ values) in neurites growing on laminin-coated compared with those growing on Con A-coated substrate.
Fig. 6.
Fig. 6.
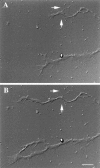
Axonal growth on Con A-coated substrate.A, B, DIC images of neurites growing on Con A-coated substrate. The image B was taken 2 hr and 15 min after image A. Notice the constant position of the axon, branch point, and filopodia-like processes (arrows) relative to the substrate. Scale bar, 20 μm.
Fig. 7.
Fig. 7.
Effect of Brefeldin A treatment on axonal growth. A, DIC images of a neurite growing on Con A-coated substrate. Numbers indicate time in minutes. Brefeldin A (10 μg/ml) was applied 16 min after the start of an experiment. Elongation of the neurite after BFA application visibly slowed down, and the growth cone retracted within 12 min after drug treatment (28 min after the start of experiment). B,C, Neurite growth on laminin-coated substrate after Brefeldin A treatment. B, Phase contrast images of a neurite. Numbers indicate time in minutes after Brefeldin A (10 μg/ml) application. Axonal growth continues for at least 3 hr after drug treatment. C, Quantitative analysis of axonal elongation; data from B. The growth cone position relative to the substrate is plotted in 20 min intervals (open circles). The average direction of axonal growth is indicated by a big arrow. The growth cone elongation appears to slow down within 80 min after application of BFA. Approximately 5 hr after drug application, the growth cone retracts. However, elongation resumed and continued for ∼80 min, after which the neurite retracted. Scale bars: A, 10 μm;B, C, 40 μm.
Fig. 8.
Fig. 8.
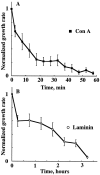
Quantitative analysis of the effects of BFA on axonal growth on Con A-coated (A) and laminin-coated (B) surfaces. In each experiment, the average rate of axonal growth before BFA application (10 μg/ml) was determined for a period of 20–30 min. The rate of axonal elongation was measured as a function of time after the onset of BFA application and was normalized to that before BFA application. Eachpoint represents the mean ± SEM of 14 (A) and 20 (B) different experiments. For neurites growing on Con A-coated substrate in 2 of 16 experiments, we observed a decrease in axonal diameter a few minutes after BFA application. These neurites continued to grow for at least 2 hr and became progressively thinner. They were excluded from the analysis.

References

    1. Ahmad FJ, Baas PW. Microtubules released from the neuronal centrosomes are transported into the axon. J Cell Sci. 1995;108:2761–2769. - PubMed
    1. Baas PW. Microtubules and axonal growth. Curr Opin Cell Biol. 1997;9:29–36. - PubMed
    1. Baas PW, Ahmad FJ. The transport properties of axonal microtubules establish their polarity orientation. J Cell Biol. 1993;120:1427–1437. - PMC - PubMed
    1. Baas PW, Joshi HC. γ-Tubulin distribution in the neuron: implications for the origins of neurite microtubules. J Cell Biol. 1992;119:171–178. - PMC - PubMed
    1. Bamburg JR, Bray D, Chapman K. Assembly of microtubules at the tip of growing axons. Nature. 1986;321:788–790. - PubMed

Publication types

MeSH terms

LinkOut - more resources