. 1998 Feb 1;18(3):932-47.
doi: 10.1523/JNEUROSCI.18-03-00932.1998.

Mitochondrial membrane potential and nuclear changes in apoptosis caused by serum and nerve growth factor withdrawal: time course and modification by (-)-deprenyl

Affiliations

Mitochondrial membrane potential and nuclear changes in apoptosis caused by serum and nerve growth factor withdrawal: time course and modification by (-)-deprenyl

J S Wadia et al. J Neurosci. .

Abstract

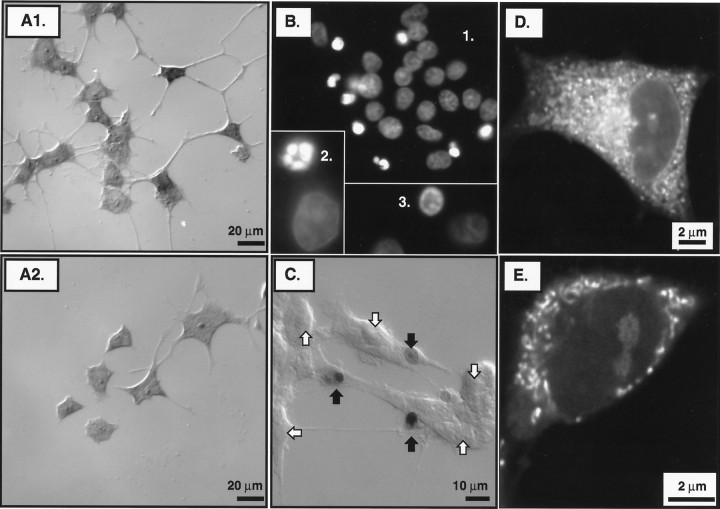
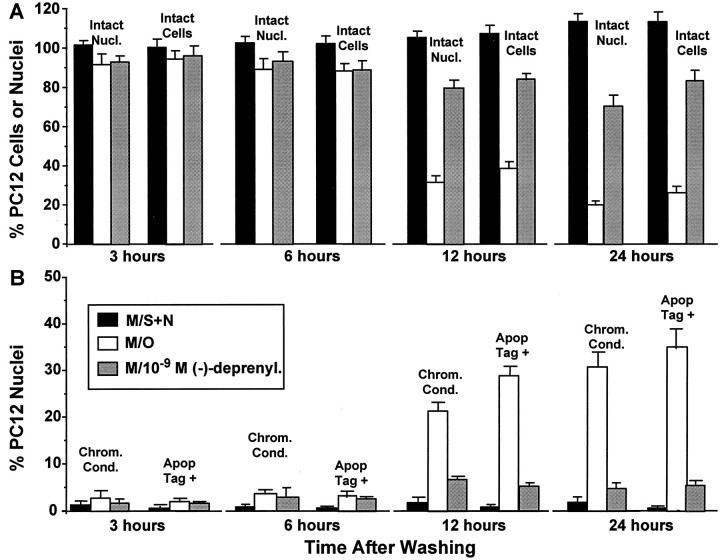
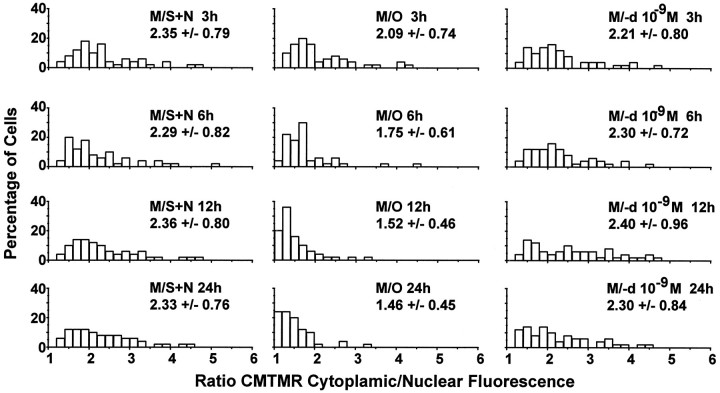
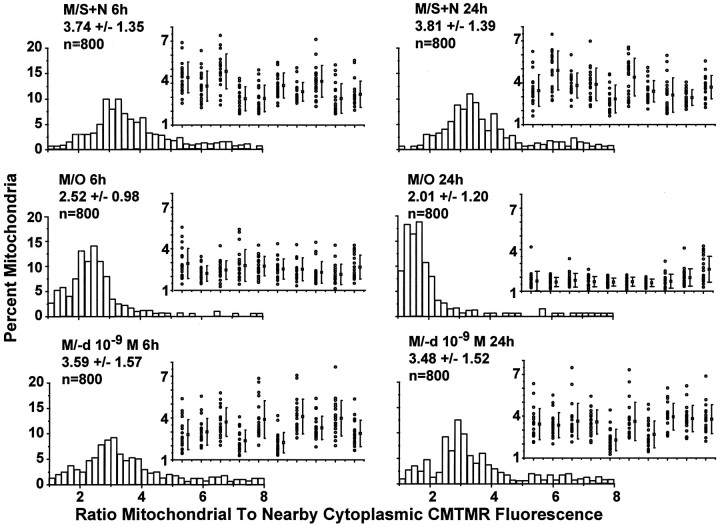
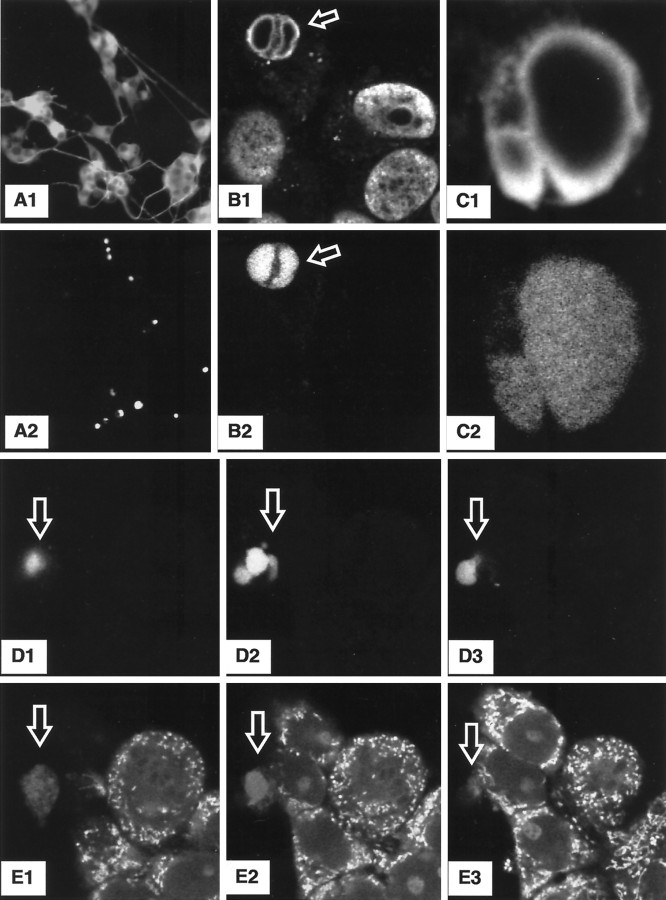
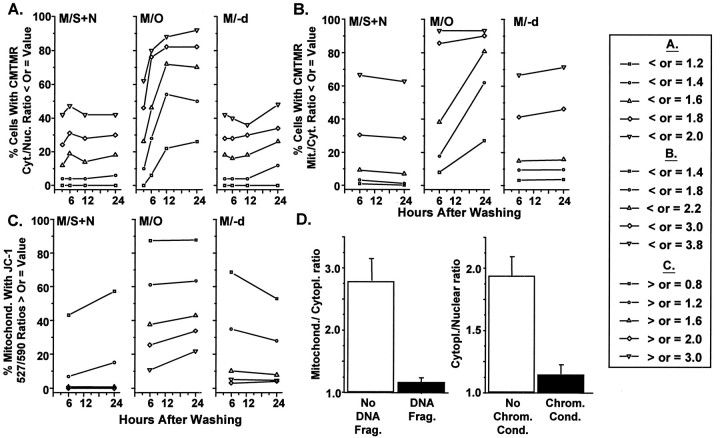
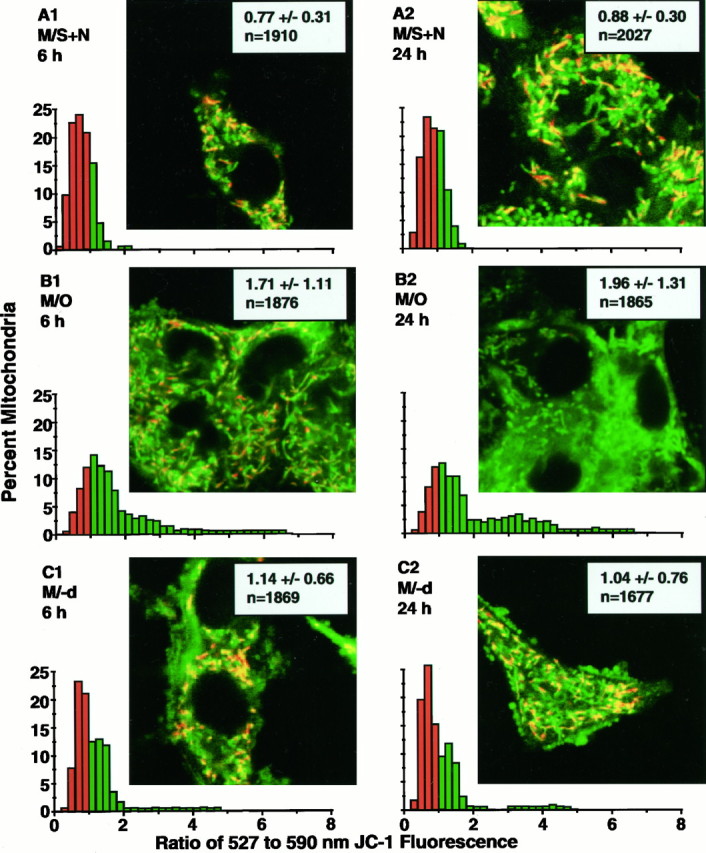
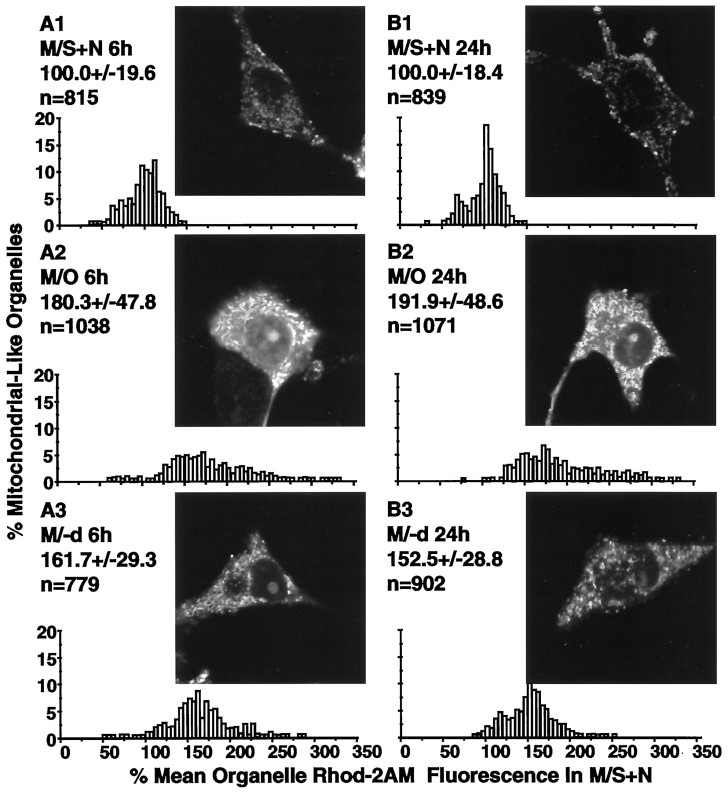
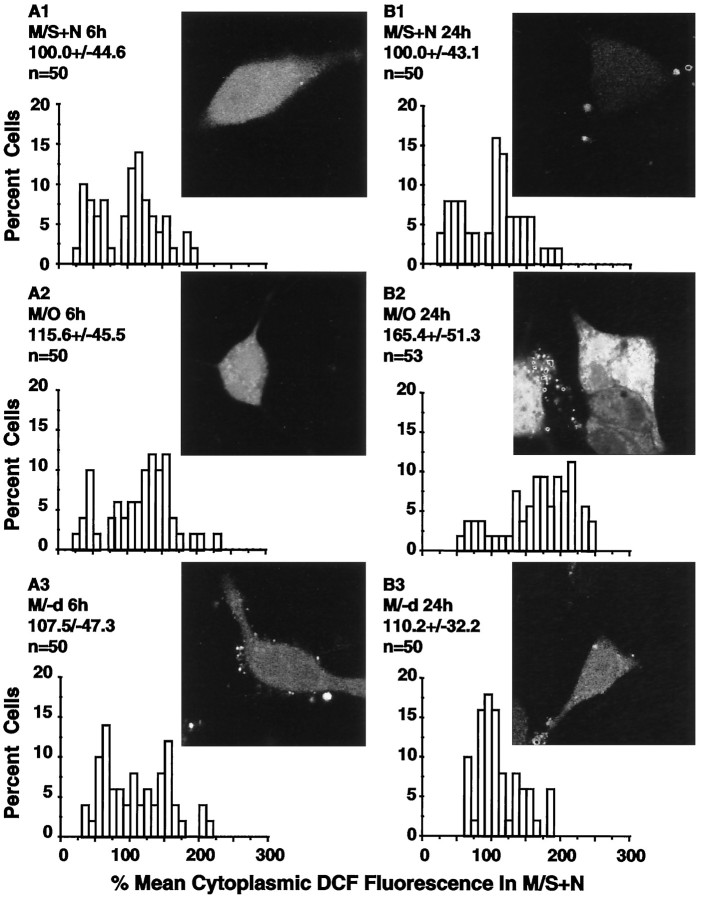
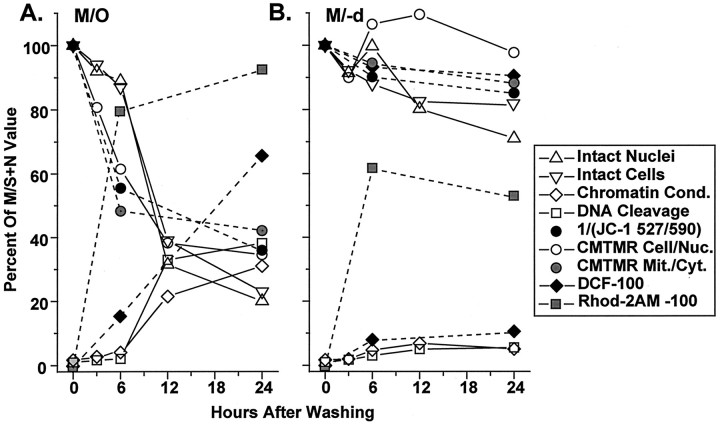
Studies in non-neural cells have suggested that a fall in mitochondrial membrane potential (DeltaPsiM) is one of the earliest events in apoptosis. It is not known whether neural apoptosis caused by nerve growth factor (NGF) and serum withdrawal involves a decrease in DeltaPsiM. We used epifluorescence and laser confocal microscopy with the mitochondrial potentiometric dyes chloromethyl-tetramethylrosamine methyl ester and 5,5',6, 6'-tetrachloro-1,1',3,3'-tetraethybenzimidazol carbocyanine iodide to estimate DeltaPsiM. PC12 cells were differentiated in media containing serum and NGF for 6 d before withdrawal of trophic support. After washing, the cells were incubated with media containing serum and NGF (M/S+N), media without serum and NGF, or media with the "trophic-like" monoamine oxidase B inhibitor, (-)-deprenyl. Mitochondria in cells without trophic support underwent a progressive shift to lower DeltaPsiM values that was significant by 3 hr after washing. The percentages of cells with nuclear chromatin condensation or nuclear DNA fragmentation were not significantly increased above those for cells in M/S+N until 6 hr after washing. Replacement of cells into M/S+N or treatment with (-)-deprenyl markedly reduced the proportion of mitochondria with decreased DeltaPsiM. Measurements of cytoplasmic peroxyl radical levels with 2',7'-dihydrodichlorofluorescein fluorescence and intramitochondrial Ca2+ with dihydro-rhodamine-2-acetylmethyl ester indicated that cytoplasmic peroxyl radical levels were not increased until after 6 hr, whereas increases in intramitochondrial Ca2+ paralleled the decreases in DeltaPsiM. (-)-Deprenyl appeared to alter the relationship between intramitochondrial Ca2+ levels and DeltaPsiM, possibly through its reported capacity to increase the synthesis of proteins such as BCL-2.


Figures

Fig. 1.
Fig. 1.
Estimation of cell survival, nuclear chromatin condensation, nuclear DNA fragmentation, and mitochondrial membrane potential. A1, Typical interference contrast micrograph of methylene blue-stained PC12 cells that were partially neuronally differentiated in M/S+N for 6 d and were then washed to remove trophic proteins and immediately replaced in M/S+N to reestablish trophic support at 12 hr before fixation for histology.A2, Similar micrograph for cells that were washed and trophically withdrawn by placement in M/O at 12 hr before fixation.B, Fluorescence photomicrographs of in situ nuclei stained with Hoechst 33258 at 12 hr after washing and placement into M/O. Normal Hoechst 33258-stained nuclei showed a diffuse, granular substructure with division by fine septate-like structures (inset 1). Apoptotic nuclei showed dense staining characterized by the formation of shrunken, intensely fluorescent lobular structures, those being apoptotic bodies (inset 2) or ring-like structures (inset 3). C, Interference contrast micrograph of cells reacted for in situ detection of nuclear DNA fragmentation using the Apop Tag method at 12 hr after washing and placement into M/O. The method revealed nuclei that were shrunken in comparison to those without evidence of DNA fragmentation. Nuclear DNA fragmentation is evident in three of the nuclei, the external plasma membranes of which appear intact using interference contrast microscopy. D, Typical epifluorescence micrograph of CMTMR fluorescence for a partially neuronally differentiated PC12 cell grown in M/S+N and fixed 24 hr after washing and replacement into M/S+N. CMTMR fluorescence from individual mitochondria was discernible using epifluorescence microscopy with 1000×, 1.3 NA objective. However, the thickness of the optical sections resulted in the superimposition of the fluorescence signals from adjacent mitochondria.E, Confocal micrograph of a cell in M/S+N at 24 hr after washing. A pinhole value of 50 produced optical sections that were sufficiently thin to allow for fluorescence measurements from individual mitochondria and the immediately adjacent cytoplasm without superimposition of fluorescence from nearby mitochondria.
Fig. 2.
Fig. 2.
Estimates of the time course of cell death and the appearance of the nuclear stigmata (chromatin condensation and DNA fragmentation) of apoptosis. A, Values at four time points after washing for the two methods that we used to estimate cell survival: counts of intact nuclei after plasma membrane lysing using a hemocytometer, and counts of intact cells from coverslips after fixation and methylene blue staining. B, Percentages of cells with nuclear chromatin condensation and nuclear DNA fragmentation at the same four time points.
Fig. 3.
Fig. 3.
Estimation of the time course of changes in average cellular ΔΨM using epifluorescence imaging of the rhodamine derivative CMTMR. Distributions for cell body cytoplasmic CMTMR fluorescence divided by CMTMR nuclear fluorescence (cytoplasmic/nuclear ratio) as an estimate of changes in average ΔΨM after washing in each cell for the three treatments at four time points.
Fig. 4.
Fig. 4.
Estimation of the changes in ΔΨMfor individual mitochondria using confocal microscopic imaging of CMTMR fluorescence. Distributions of the CMTMR mitochondrial/cytoplasmic ratios for the three treatments at the 6 and 24 hr time points together with corresponding examples (inset) of the CMTMR mitochondrial/cytoplasmic ratios for 20 mitochondria from 10 randomly chosen cells.
Fig. 5.
Fig. 5.
Nuclear DNA fragmentation demonstrated with BODIPY-dUTP simultaneously with CMTMR staining to estimate ΔΨM. A1, A2, Low-power epifluorescence micrographs of the same image fields of cells after 12 hr in M/O that were immunoreacted for tubulin (A1) and also reacted using the BODIPY-dUTP method for detecting nuclear DNA fragmentation (A2). Confocal laser images of identical fields for tissue dually reacted with an anti-histone antibody are shown inB1 and C1, and BODIPY-dUTP is shown inB2 and C2. D1–D3, E1–E3, Identical confocal image fields for serial image planes (separated by ∼1.0 μm) through a group of partially neuronally differentiated PC12 cells in M/O at 6 hr after washing. Cultures are stained for BODIPY-dUTP nuclear staining and CMTMR mitochondrial fluorescence, respectively.
Fig. 6.
Fig. 6.
Time course of changes in the levels of CMTMR and JC-1 fluorescence and differences in CMTMR fluorescence for cells with or without nuclear DNA fragmentation or chromatin condensation. Each plot in A–C shows percentage of cells or mitochondria with CMTMR fluorescence ratios or JC-1 527:590 nm fluorescence ratio values that are less than values shown to correspond with specific ΔΨM levels in other cellular models. D, Bar graphs of the CMTMR mitochondrial/cytoplasmic ratios and CMTMR cytoplasmic/nuclear ratios for cells in M/O at 6 hr after washing with and without evidence of nuclear DNA fragmentation or chromatin condensation shown by staining with Hoechst 33258.
Fig. 7.
Fig. 7.
Dual-emission images for JC-1 fluorescence. Eachinset image shows the effect of superimposition of the recolored 527 and 590 nm images by the algebraic addition of corresponding pixels: regions of mitochondria with predominant 527 nm emission color green, those with overlapping 527 and 590 nm emission color yellow, and those with higher 590 nm emission color orange–red in the superimposed images. Each panel shows typical examples of superimposed JC-1 images and 527:590 nm emission ratio distributions for the pixel domains of individual mitochondria for the three treatment conditions at 6 and 24 hr after washing. A1, A2, C1, C2, For cells in M/S+N and M/−d, respectively, show a mixture of green,yellow, and orange–red mitochondria in a single cell and appear to indicate a wide range of ΔΨMvalues for mitochondria within a single cell. The corresponding distributions for these panels show that the majority of mitochondria have 527:590 nm emission ratios that are <1.0, indicating high levels of ΔΨM. B1, Cells in M/O at 6 hr and relative decrease in orange–red mitochondria and a preponderance of yellow and greenmitochondria found in those cells. As shown in the accompanying distribution, those changes reflect a shift in the mitochondrial 527:590 nm emission ratios to higher values, with a majority of the mitochondria showing ratios of >1.0. B2, Cells in M/O at 24 hr and little, if any, yellow ororange–red. The accompanying distribution shows a further shift of the emission ratios to values of >1.0.
Fig. 8.
Fig. 8.
Rhod-2AM as an indicator of mitochondrial Ca2+. A1–A3, B1–B3, insets, Typical confocal microscopic images of living cells stained with Rhod-2AM for the three treatments at 6 and 24 hr after washing. The accompanyinggraphs show the distributions for the Rhod-2AM fluorescence for subcellular structures likely to correspond to mitochondria at the two time points. Values above each distribution present the mean ± SD and the numbers of mitochondria examined in each group. The distributions show that Ca2+ levels in mitochondrial-like organelles were markedly elevated at both 6 and 24 hr after washing and placement in M/O and were only partially reduced by treatment with (−)-deprenyl.
Fig. 9.
Fig. 9.
DCFH fluorescence as an indicator of cytoplasmic peroxyl radical levels. A1–A3, B1–B3, insets, Typical examples of DCFH fluorescence of living cells in M/S+N, M/O, and M/−d, respectively, at 6 and 24 hr after washing. The accompanyinggraphs show the distributions for the DCFH fluorescence in the cellular cytoplasm. Values above each distribution present the mean ± SD and the number of cells examined in each group. The distributions show that cytoplasmic peroxyl radical levels were not elevated at 6 hr when ΔΨM was already markedly decreased but were elevated in cells surviving to 24 hr.
Fig. 10.
Fig. 10.
Timing of cell death, the appearance of the nuclear stigmata of apoptosis, Rhod-2AM levels in mitochondrial-like organelles, cytoplasmic peroxyl radical levels, and decreases in ΔΨM in trophically withdrawn cells. A, Time course for cells in MEM only; B, time course for those in MEM with 10−9m (−)-deprenyl. The number of intact nuclei (open triangles) determined by cell lysing and direct nuclear counting and number of intact cells (inverted open triangles) determined by methylene blue staining yielded a decrease to 30–38% of MS+N values by 12 hr and ∼20% by 24 hr. Average values for the CMTMR cytoplasmic/nuclear ratio (open circles) were used to estimate ΔΨM at 3 hr. CMTMR cytoplasmic/nuclear ratio, CMTMR mitochondrial/cytoplasmic ratio (gray circles), and the reciprocal of the JC-1 527:590 nm ratio (black circles) are presented for cells in M/O at 6 hr and show decreases of 20, 39, and 53%, respectively. By 24 hr, surviving cells showed average decreases in ΔΨM of 60–70% depending on the method used. Chromatin condensation (open diamonds) and DNA cleavage (open squares) were shown to increase above baseline only after 6 hr after trophic withdrawal. Calcium accumulation into mitochondrial-like organelles (gray squares) increased to 80% of that measured in cells in MS+N, and cytoplasmic peroxyl radical levels (black diamonds) increased linearly to 65% at 24 hr. Similar measurements were performed on cells treated with M/−d. All measurements remained similar to MS+N values with the exception of calcium accumulation into mitochondrial-like organelles, in which levels increased to 60% beyond MS+N values at 6 hr and stabilized to 50% above control at 24 hr.

References

    1. Beal MF. Mitochondria, free radicals, and neurodegeneration. Curr Opin Neurobiol. 1996;6:661–666. - PubMed
    1. Biagini G, Zoli M, Fuxe K, Agnati LF. l-Deprenyl increases GFAP immunoreactivity selectively in activated astrocytes in rat brain. NeuroReport. 1993;4:955–958. - PubMed
    1. Biagini G, Frasoldati A, Fuxe K, Agnati LF. The concept of astrocyte-kinetic drug in the treatment of neurodegenerative diseases: evidence for l-deprenyl-induced activation of reactive astrocytes. Neurochem Int. 1994;25:17–22. - PubMed
    1. Calarco PG. Polarization of mitochondria in the fertilized mouse oocyte. Dev Genet. 1995;16:36–43. - PubMed
    1. Carayon P, Portier M, Dussossoy D, Bord A, Petipretre G, Canat X, Le Fur G, Casellas P. Involvement of peripheral benzodiazepine receptors in the protection of hematopoietic cells against oxygen radical damage. Blood. 1996;87:3170–3178. - PubMed

Publication types

MeSH terms

LinkOut - more resources