. 1998 Feb 1;18(3):1161-70.
doi: 10.1523/JNEUROSCI.18-03-01161.1998.

Variability and correlated noise in the discharge of neurons in motor and parietal areas of the primate cortex

Affiliations

Variability and correlated noise in the discharge of neurons in motor and parietal areas of the primate cortex

D Lee et al. J Neurosci. .

Abstract

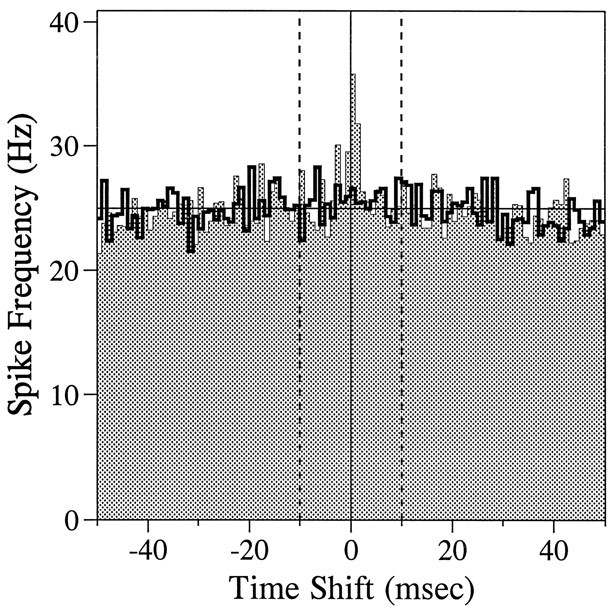
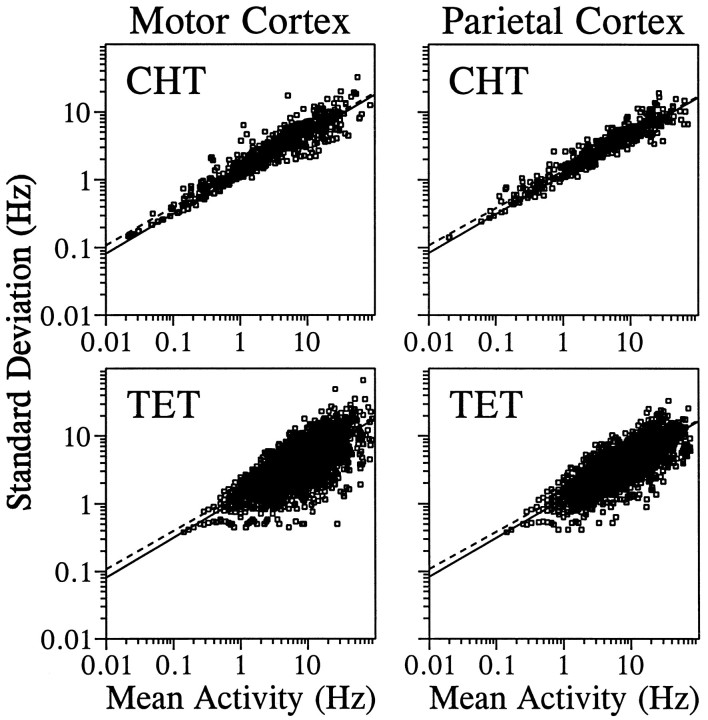
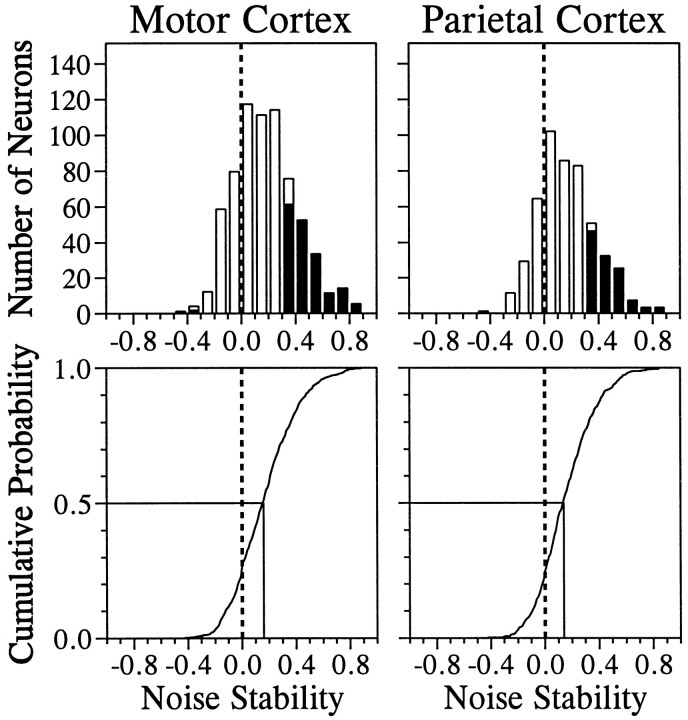
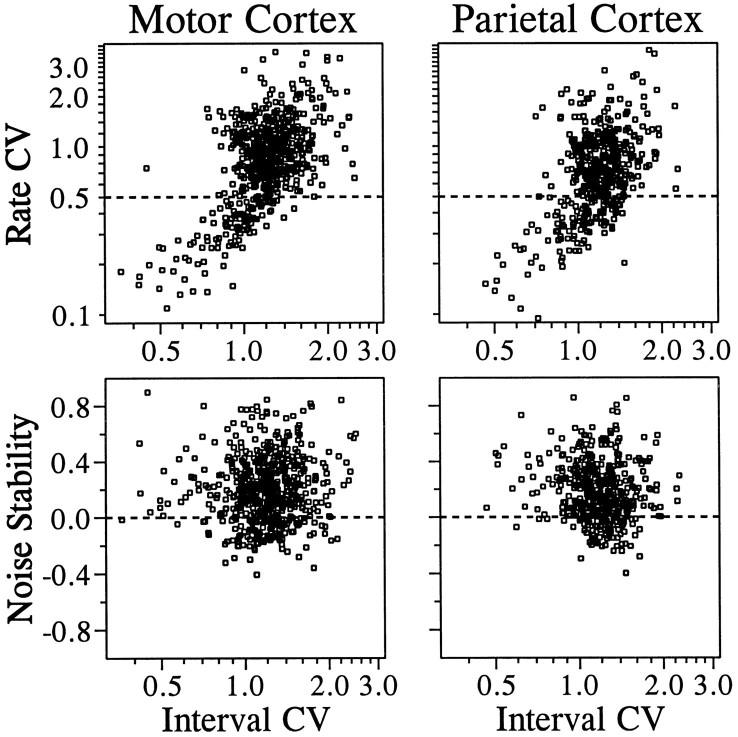
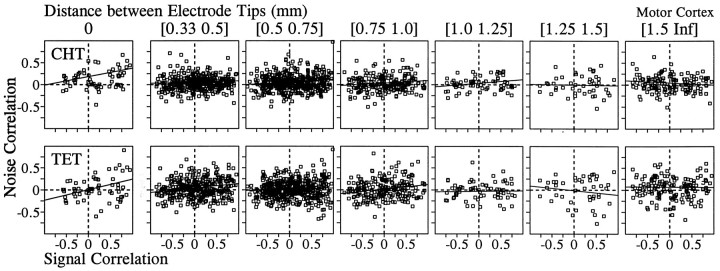
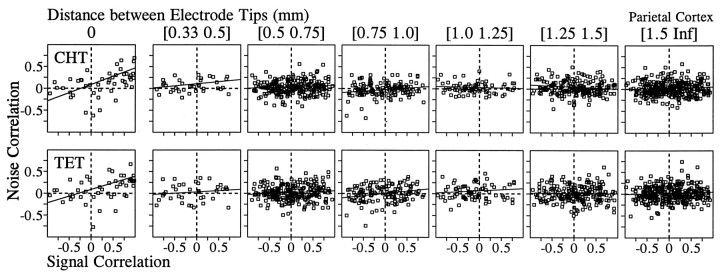
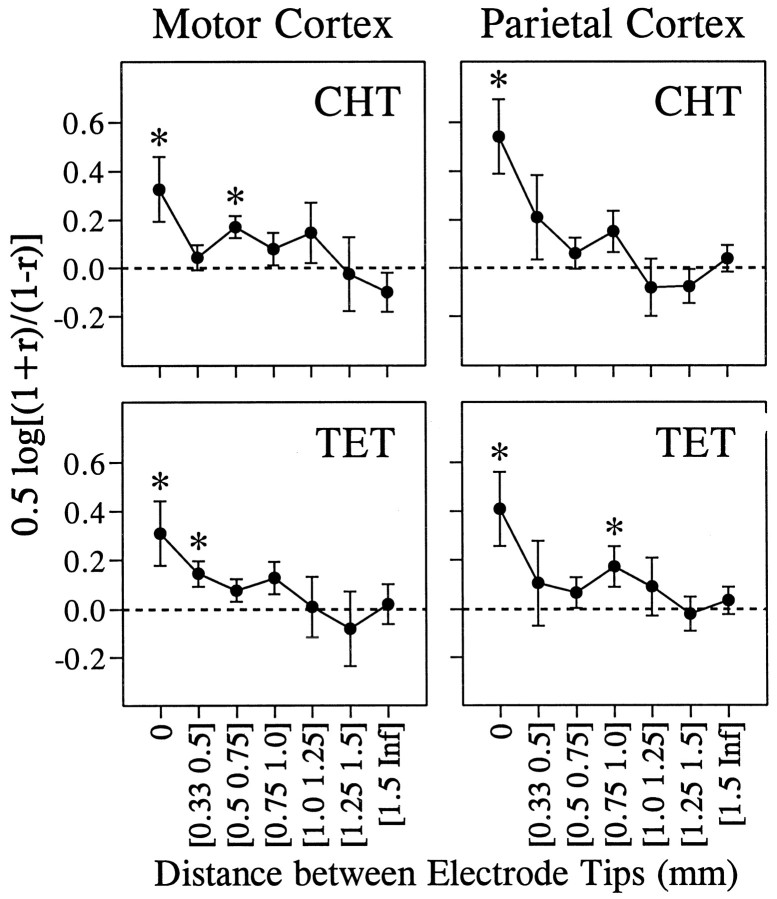
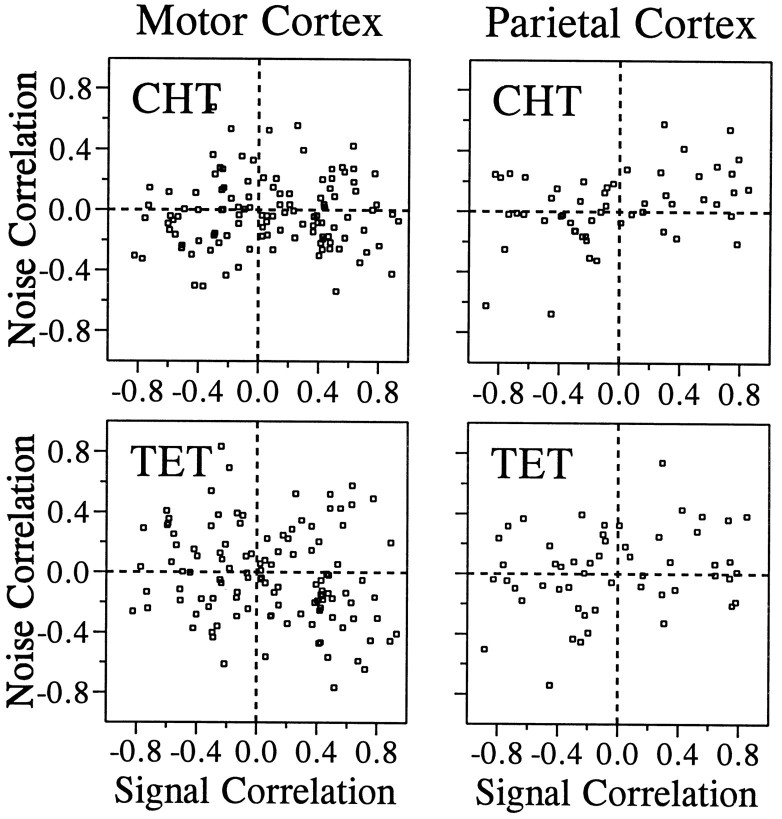
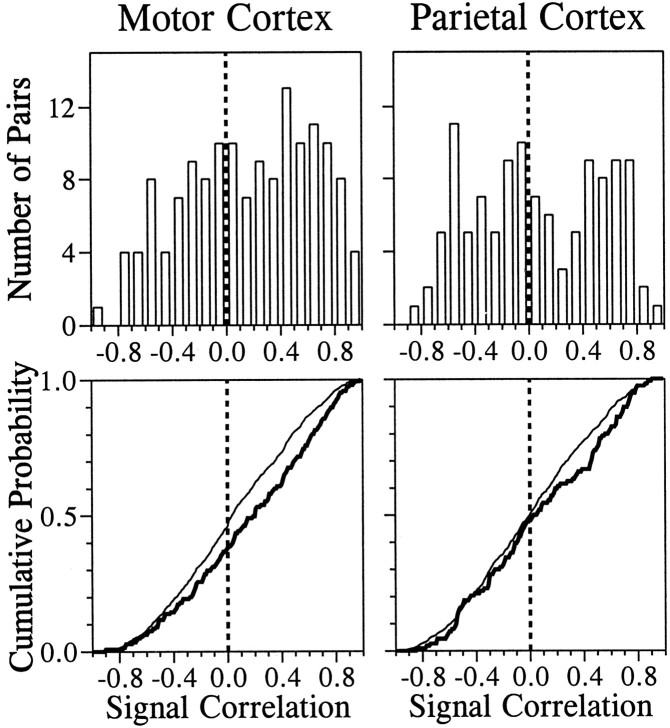
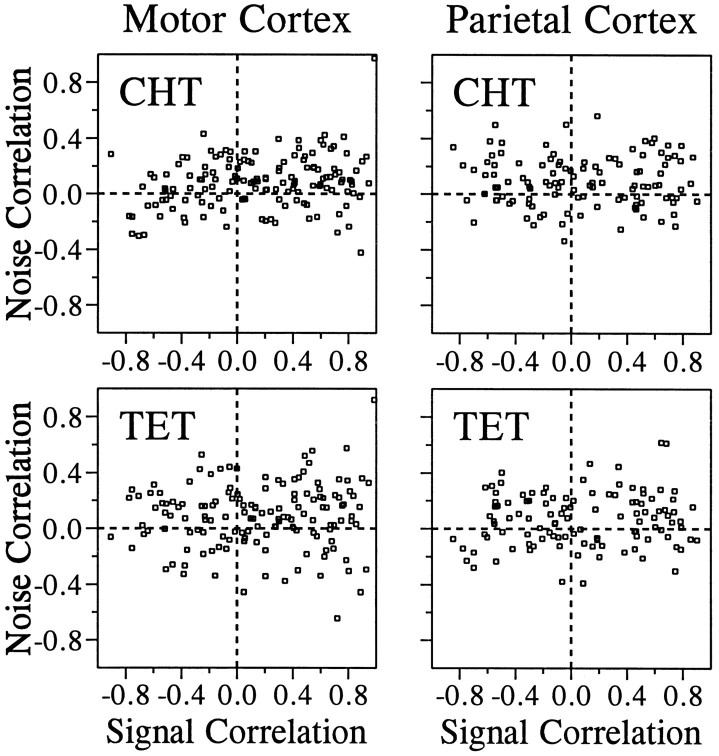
We analyzed the magnitude and interneuronal correlation of the variability in the activity of single neurons that were recorded simultaneously using a multielectrode array in the primary motor cortex and parietal areas 2/5 in rhesus monkeys. The animals were trained to move their arms in one of eight directions as instructed by a visual target. The relationship between variability (SD) and mean of the discharge rate was described by a power function with a similar exponent ( approximately 0.57), regardless of the cortical area or the behavioral condition. We examined whether the deviation from mean activity between target onset and the end of the movement was correlated on a trial-by-trial basis with variability in activity during the hold period before target onset. In both cortical areas, for about a quarter of the neurons, the neuronal noise of these two periods was positively correlated, whereas significant negative correlations were seldom observed. Overall, neurons with higher signal correlation (i.e., similar directional pattern) showed higher noise correlation in both cortical areas. On the other hand, when the data were divided according to the distance between the electrode tips from which the neurons were recorded, a consistent relationship between the signal and noise correlations was found only for pairs of neurons recorded through the same electrode. These results suggest that nearby neurons with similar directional tuning carry primarily redundant messages, whereas neurons in separate cortical columns perform more independent processing.


Figures

Fig. 1.
Fig. 1.
The CCH or cross-correlogram for a pair of neurons recorded in the motor cortex (shaded area). The histogram (thick solid line) represents an example of a shuffled CCH produced after the trials from which the two neurons were recorded were randomly shuffled. The degree of synchronized firing was measured as the area in the CCH between −10 and 10 msec (dotted vertical lines) after the baseline (thin solid horizontal line) was subtracted. In this example, none of the 500 shuffled CCHs produced greater synchronization than did the original CCH (i.e., p < 0.002).
Fig. 2.
Fig. 2.
Relationship between SD of discharge rate (y-axis) and mean discharge rate (x-axis) during the CHT (top) and the TET (bottom). Data are shown separately for the neurons in the motor cortex (left) and the parietal cortex (right). The best-fit power functions (see Results) for the CHT (dotted line) and the TET (solid line) are shown twice for each cortical area for the sake of comparison. Because each movement direction is treated separately for the discharge rates during the TET, but not for the CHT, there are eight times as many data points for the TET than for the CHT. Larger variability among the data points for the TET is probably attributable to a smaller number of trials contributing to each data point.
Fig. 3.
Fig. 3.
Top, Distribution of correlation coefficients between noise during the CHT and that during the TET, or noise stability, for the primary motor cortex (left) and the parietal cortex (right). Filled areasindicate the neurons with statistically significant correlation (p < 0.05). Bottom, Cumulative probability for the same data.
Fig. 4.
Fig. 4.
Top, Relationship between the rate CV and the interval CV during the same period for the primary motor cortex (left) and the parietal cortex (right). Bottom, Relationship between noise stability (correlation of noise between the CHT and the TET) and the interval CV.
Fig. 5.
Fig. 5.
Relationship between the signal correlation and the noise correlation in the motor cortex during the CHT (top) and the TET (bottom). Pairs of neurons were divided into seven groups according to the distance between the electrode tips from which they were recorded. Thesolid line in each panel was determined by a linear regression. The correlation coefficients for these data are shown in Figure 7.
Fig. 6.
Fig. 6.
Relationship between the signal correlation and the noise correlation in parietal areas 2/5. The same conventions described in Figure 5 apply.
Fig. 7.
Fig. 7.
Effects of the distance between the electrode tips (x-axis) on the correlation coefficient between the signal correlation and the noise correlation during the CHT (top) and the TET (bottom) for the primary motor cortex (right) and the parietal cortex (left). The y-axis shows Fisher’sz transform ± SE for the correlation coefficient between the noise correlation and the signal correlation as shown in Figures 5 and 6. The asterisks indicate the correlation coefficients that were significantly different from zero (p < 0.05).
Fig. 8.
Fig. 8.
Effects of the signal correlation on the noise correlation during the CHT (top) or the TET (bottom) for the neurons with significant noise stability in the primary motor cortex (left) or the parietal cortex (right).
Fig. 9.
Fig. 9.
Top, Distribution of the signal correlation between pairs of neurons with significant synchronized firing in the primary motor cortex (left) and the parietal cortex (right) is shown. These neurons were selected according to the criteria described in Materials and Methods (see also Fig. 1). Bottom, Thick linesshow the cumulative probability for the same data, and thin lines show the cumulative probability for the signal correlation between neurons without significant synchronized firing.
Fig. 10.
Fig. 10.
Effects of the signal correlation on the noise correlation during the CHT (top) or the TET (bottom) for neurons with significant synchronized firing in the primary motor cortex (left) and the parietal cortex (right).

References

    1. Aldridge JW, Gilman S. The temporal structure of spike trains in the primate basal ganglia: afferent regulation of bursting demonstrated with precentral cerebral ablation. Brain Res. 1991;543:123–138. - PubMed
    1. Amirikian B, Georgopoulos AP. Motor cortical organization of preferred directions. Soc Neurosci Abstr. 1997;23:1555.
    1. Arieli A, Sterkin A, Grinvald A, Aetsen A. Dynamics of ongoing activity: explanation of the large variability in evoked cortical responses. Science. 1996;273:1868–1871. - PubMed
    1. Ashe J, Georgopoulos AP. Movement parameters and neural activity in motor cortex and area 5. Cereb Cortex. 1994;6:590–600. - PubMed
    1. Berman NJ, Douglas RJ, Martin KAC. GABA-mediated inhibition in the neural networks of visual cortex. In: Mize RR, Marc RE, Sillito AM, editors. Progress in brain research. Elsevier; Amsterdam: 1992. pp. 443–476. - PubMed

Publication types

LinkOut - more resources