. 1998 Jan 23;279(5350):566-70.
doi: 10.1126/science.279.5350.566.

The role of visual experience in the development of columns in cat visual cortex

Affiliations

The role of visual experience in the development of columns in cat visual cortex

M C Crair et al. Science. .

Abstract

The role of experience in the development of the cerebral cortex has long been controversial. Patterned visual experience in the cat begins when the eyes open about a week after birth. Cortical maps for orientation and ocular dominance in the primary visual cortex of cats were found to be present by 2 weeks. Early pattern vision appeared unimportant because these cortical maps developed identically until nearly 3 weeks of age, whether or not the eyes were open. The naïve maps were powerfully dominated by the contralateral eye, and experience was needed for responses to the other eye to become strong, a process unlikely to be strictly Hebbian. With continued visual deprivation, responses to both eyes deteriorated, with a time course parallel to the well-known critical period of cortical plasticity. The basic structure of cortical maps is therefore innate, but experience is essential for specific features of these maps, as well as for maintaining the responsiveness and selectivity of cortical neurons.


Figures
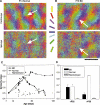
Fig. 1
Fig. 1
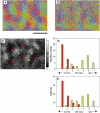
Maps of stimulus orientation match between the two eyes even when cats are reared without patterned visual experience. (A) Orientation maps, obtained separately by stimulation of the contralateral or ipsilateral eye, from a young (P14) cat with normal visual experience. Color of each pixel indicates stimulus orientation producing the greatest optical response; colored bars show scale. (B) Orientation maps from the two eyes of a young (P19) BD cat. White arrows in (A) and (B) are drawn at the same location in both eyes' maps. Scale bar (black), 1 mm. (C) The similarity between orientation maps from the two eyes, as measured by an index (23) for which two unrelated maps would have a similarity of 0.5 and identical maps would have a similarity of 1.0. The abscissa is shown on a logarithmic scale. Significance is indicated by comparison with randomized data, computed from the real data by rotating the orientation map from one eye by 180°. (D) Summary of the similarity indices from all normal cats (20 hemispheres from 15 cats) and BD cats (15 hemispheres from 10 cats), grouped by age and rearing condition, compared with the randomized data.
Fig. 2
Fig. 2
Development of orientation maps in normal and BD cats. (A) Maps shown are from the opposite hemisphere of the cat depicted in Fig. 1A. (B) Maps from a slightly older normal cat are similar in the two eyes, and they become more selective (C) by the end of the first postnatal month. (D) Orientation maps in a young BD cat. (E) Unlike normals, the initial contralateral bias persists in BD cats, until in old BD cats (F), the orientation map deteriorates significantly and is difficult to detect. Nonetheless, ocular dominance ratio maps from such older BD cats show a strong pattern (26), indicating that responses are present but are not orientation selective. Scale bar (black), 1 mm.
Fig. 3
Fig. 3
Development of orientation selectivity and elimination of contralateral bias. (A) Comparison of orientation selectivity as a function of age for the contralateral eye of cats reared under normal and BD conditions. Selectivity is measured using an index of orientation tuning (17). (B and C) Development of orientation selectivity for contralateral and ipsilateral eyes of normal (B) and BD (C) cats. (D) Eye dominance index (7) in normal and BD cats at young and older ages. The difference between normal and BD cats is significant at the older ages (P < 0.0001). (E) Single-unit responses in young normal and BD cats also show a strong contralateral bias. Responses from five cats in the present study and three from an earlier study (16) are summarized.
Fig. 4
Fig. 4
Maps of ocular dominance are visible by P14. (A) Orientation map obtained through the contralateral eye. Scale bar, 1 mm. (B) Orientation map through the ipsilateral eye. (C) Ocular dominance ratio map (17), showing patchy regions responding more strongly to the ipsilateral eye (gray areas) or contralateral eye (dark areas). Green (ipsi-eye) and red (contra-eye) arrows mark locations of 10 sites that appeared most biased toward one or the other eye, as judged from the optical map. Calibration bar shows relative optical response through the two eyes, from −0.075% (white, ipsi-eye) to +0.075% (black, contra-eye), where 0% is equal response to the two eyes. (D) Microelectrode penetrations were then made into these sites without knowledge of the eye preference in the optical maps. Histograms show ocular dominance of single units (six cells per penetration) assessed on the conventional 1-to-7 scale (2), grouped by eye preference from the ocular dominance map [(colors as in (C)]. (E) Summary of similar targeted penetrations made in four cats, age P15 and younger (n = 52 cells for ipsi-targeted, n = 67 for contra-targeted).

Similar articles

Cited by

References

    1. Wiesel T. Nature. 1982;299:583. - PubMed
    2. Movshon JA, Kiorpes L. In: Development of Sensory Systems in Mammals. Coleman JR, editor. Wiley; New York: 1990. pp. 155–202.
    1. Hubel DH, Wiesel TN. J. Physiol. (London) 1962;160:106. - PMC - PubMed
    1. Bonhoeffer T, Grinvald A. Brain Mapping: The Methodology. Academic Press; New York: 1996. pp. 75–97. Optical intrinsic signal responses were measured as in. and in (14). Normalization by response to stimulation with a blank screen was used in all figures and analysis.
    1. Microelectrode studies have found single units that are selective for orientation at P8 (30) and we have seen clear orientation maps as early as P12

    1. Wiesel TN, Hubel DH. J. Comp. Neurol. 1974;158:307. - PubMed
    2. Blakemore C, Van Sluyters RC. J. Physiol. (London) 1975;248:663. - PMC - PubMed
    3. Gödecke I, Bonhoeffer T. Nature. 1996;379:251. - PubMed
    4. Gödecke I, Kim D, Bonhoeffer T, Singer W. Eur. J. Neurosci. 1997;9:1754. - PubMed

Publication types