. 1998 Jan;180(2):265-73.
doi: 10.1128/JB.180.2.265-273.1998.

Initiation and velocity of chromosome replication in Escherichia coli B/r and K-12

Affiliations

Initiation and velocity of chromosome replication in Escherichia coli B/r and K-12

M Bipatnath et al. J Bacteriol. 1998 Jan.

Abstract

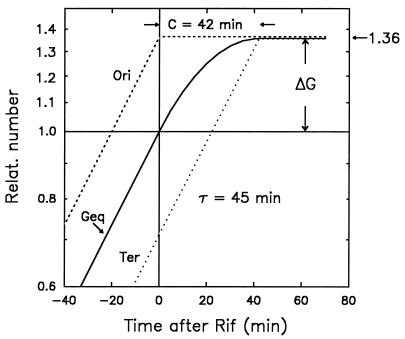
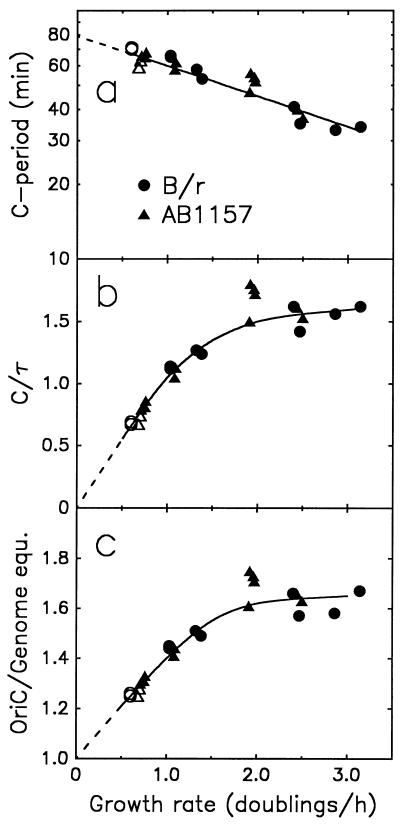
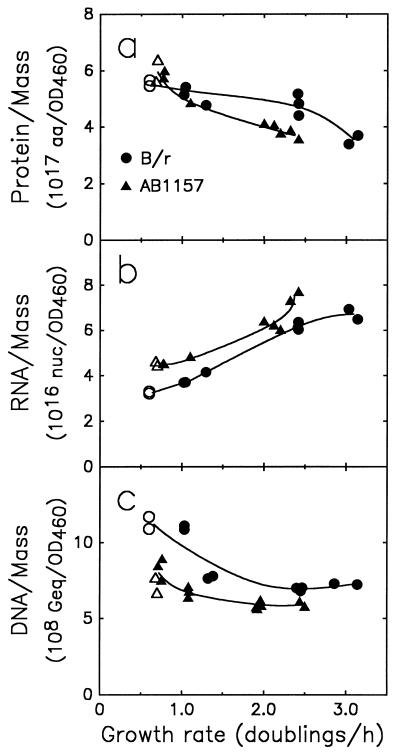
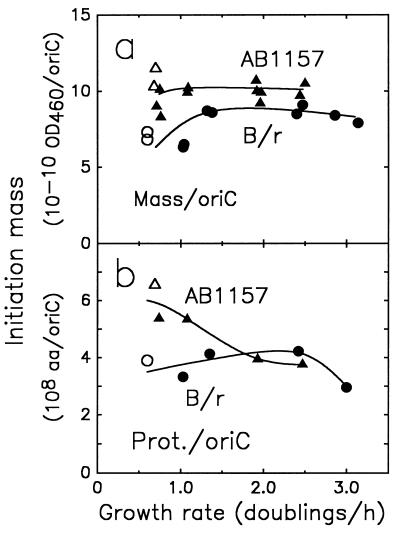
The macromolecular composition and a number of parameters affecting chromosome replication were examined over a range of exponential growth rates in two common Escherichia coli strains, B/r and K-12 AB1157. Based on improved measurements of DNA after treatment of exponential cultures with rifampin, the cell mass per chromosomal replication origin (initiation mass) and the time required to replicate the chromosome from origin to terminus (C period) were determined. For these two strains, the initiation mass approached values of 8 x 10(-10) and 10 x 10(-10) units of optical density (at 460 nm) of culture mass per oriC, respectively, at growth rates above 1 doubling/h (at 37 degrees C). The amount of protein per oriC decreased with increasing growth rate for AB1157 and remained nearly constant for the B/r strain. The C period decreased for both strains in an essentially identical manner from about 70 min at 0.6 doublings/h to about 33 min at 3 doublings/h. From the initiation mass and C period, relative or absolute copy numbers for genes with known map locations can be accurately determined at different growth rates. At growth rates above 2 doublings/h, when chromosomes are highly branched, genes near the origin are about threefold more prevalent than genes near the terminus. At a growth rate of 0.6 doubling/h, this ratio is only about 1.7, which reflects the lower degree of chromosome branching.


Figures

FIG. 1
FIG. 1
Theoretical accumulation of DNA in an exponential culture of E. coli treated with rifampin. The method used to find the number of replication origins and the C period from the accumulation of DNA after stopping initiations with rifampin (Rif) is illustrated. Solid line, DNA in genome equivalents (Geq) in a given volume of culture, normalized to 1.0 at t = 0 when rifampin is added to the culture; stippled line, number of replication origins (Ori); dotted line, number of replication termini (Ter). The horizontal distance between the origin and terminus curve corresponds to C, and the vertical distance between the origin and DNA curve (ΔG) represents the number of origins per genome equivalent of DNA. Relat., relative.
FIG. 2
FIG. 2
Accumulation of DNA in E. coli B/r grown in LB medium after treatment with rifampin (Rif) to inhibit initiation of rounds of replication. (a) Growth curve (OD600); (b) DNA accumulation (A600 of diphenylamine assay); (c) replot of the DNA curve in panel b after normalization to 1.0 at t = 0, the time of rifampin addition. The parameter γ is defined as the difference of the exponential curve (dashed) minus observed values. The solid curve was generated as a best fit by equation 3 (Appendix). (d) The formula image curve extrapolates to d = 2.5 min on the abscissa. This value is an estimate of the delay in the action of rifampin on initiation of replication (see text and Appendix). Relat., relative; Theor., theoretical.
FIG. 3
FIG. 3
Growth rate variation in the velocity of chromosome replication. (a and b) C period (in minutes in panel a; period as a fraction of culture doubling time, τ, in panel b) and (c) number of origins per genome equivalent of DNA are plotted as functions of growth rate for E. coli B/r (circles) and the K-12 strain AB1157 (triangles). The media used were (in the order of increasing growth rate) succinate minimal (open symbols), glycerol minimal, glucose minimal, glucose-amino acids, and LB (solid symbols). Genome equ., genome equivalents.
FIG. 4
FIG. 4
Protein (a), RNA (b), and DNA (c) per mass unit of culture (OD460) were measured as functions of growth rate for E. coli B/r and the K-12 strain AB1157. The media and symbols used are as described in the legend to Fig. 3. aa, amino acids; nuc, nucleotides; Geq, genome equivalents.
FIG. 5
FIG. 5
Relationship between initiation mass and exponential growth rate. Initiation mass expressed as OD460 units of culture mass per oriC (a) and as total protein in amino acid residues per oriC (b) as a function of the growth rate is illustrated. The media and symbols used are as described in the legend to Fig. 3. Open symbols, succinate medium; solid symbols, other media. aa, amino acids; Prot., protein.
FIG. A1
FIG. A1
Relationship between culture mass density and OD. A culture with an OD460 = 0.812 was diluted to 0.2, 0.4, etc. (relative concentrations on abscissa), and the OD460 of these dilutions was determined (points on the curve). The curve shown is a parabola that has been calculated (equation 7, with b = 0.15). The parabolic relationship can be used to find exact mass densities (triangles, curve labeled M) of cultures from the observed OD (see text for details). obs., observed; calc., calculated; Relat., relative.
FIG. A2
FIG. A2
Effect of different acetaldehyde concentrations on the colorimetric diphenylamine assay for DNA. (a) Assays with DNA (filled symbols) and without DNA (open symbols; blanks). (b) Differences of assay values, with DNA minus blank. The graph shows that acetaldehyde alone reacts with the diphenylamine without reaching a plateau, whereas the reaction with DNA is complete in 5 to 10 h and independent of the acetaldehyde concentration in the range tested. Blk., blank; nucleot., nucleotides; acetald., acetaldehyde.
FIG. A3
FIG. A3
Calibration of diphenylamine assay for DNA, with either CT-DNA or AdR. (a) Reaction kinetics observed with equal amounts of CT-DNA or AdR. In DNA, only deoxyribose residues of purine nucleotides are assumed to react. (b) Ratio of the two curves in panel a, CT-DNA/AdR, after division by 0.5 (50% purines in DNA). The curve shows that the reaction with DNA (apurinic acid) is faster than the reaction with AdR and reaches a 23% higher value than expected from the assumption that the contribution of purine nucleotides in DNA to the diphenylamine reaction is equivalent to that of AdR. Blk., blank; nucleot., nucleotides.

References

    1. Bachmann B J. Linkage map of Escherichia coli K-12, edition 8. Microbiol Rev. 1990;54:130–197. - PMC - PubMed
    1. Bachmann B J. Derivations and genotypes of some mutant derivatives of Escherichia coli K-12. In: Neidhardt F C, Curtiss III R, Ingraham J L, Lin E C C, Low K B, Magasanik B, Reznikoff W S, Riley M, Schaechter M, Umbarger H E, editors. Escherichia coli and Salmonella: cellular and molecular biology. 2nd ed. Washington, D.C: ASM Press; 1996. pp. 2460–2488.
    1. Berlyn M K B, Low K B, Rudd K E. Linkage map of Escherichia coli K-12, edition 9. In: Neidhardt F C, Curtiss III R, Ingraham J L, Lin E C C, Low K B, Magasanik B, Reznikoff W S, Riley M, Schaechter M, Umbarger H E, editors. Escherichia coli and Salmonella: cellular and molecular biology. 2nd ed. Washington, D.C: ASM Press; 1996. pp. 1715–1902.
    1. Bird R E, Louarn J, Martuscelli J, Caro L. Origin and sequence of chromosome replication in Escherichia coli. J Mol Biol. 1972;70:549–566. - PubMed
    1. Boye E, Stokke T, Kleckner N, Skarstad K. Coordinating DNA replication initiation with cell growth: differential roles for DnaA and SeqA proteins. Proc Natl Acad Sci USA. 1996;93:12206–12211. - PMC - PubMed

Publication types

LinkOut - more resources