. 1998 Feb;72(2):1345-53.
doi: 10.1128/JVI.72.2.1345-1353.1998.

Oral immunization with recombinant Norwalk virus-like particles induces a systemic and mucosal immune response in mice

Affiliations

Oral immunization with recombinant Norwalk virus-like particles induces a systemic and mucosal immune response in mice

J M Ball et al. J Virol. 1998 Feb.

Abstract

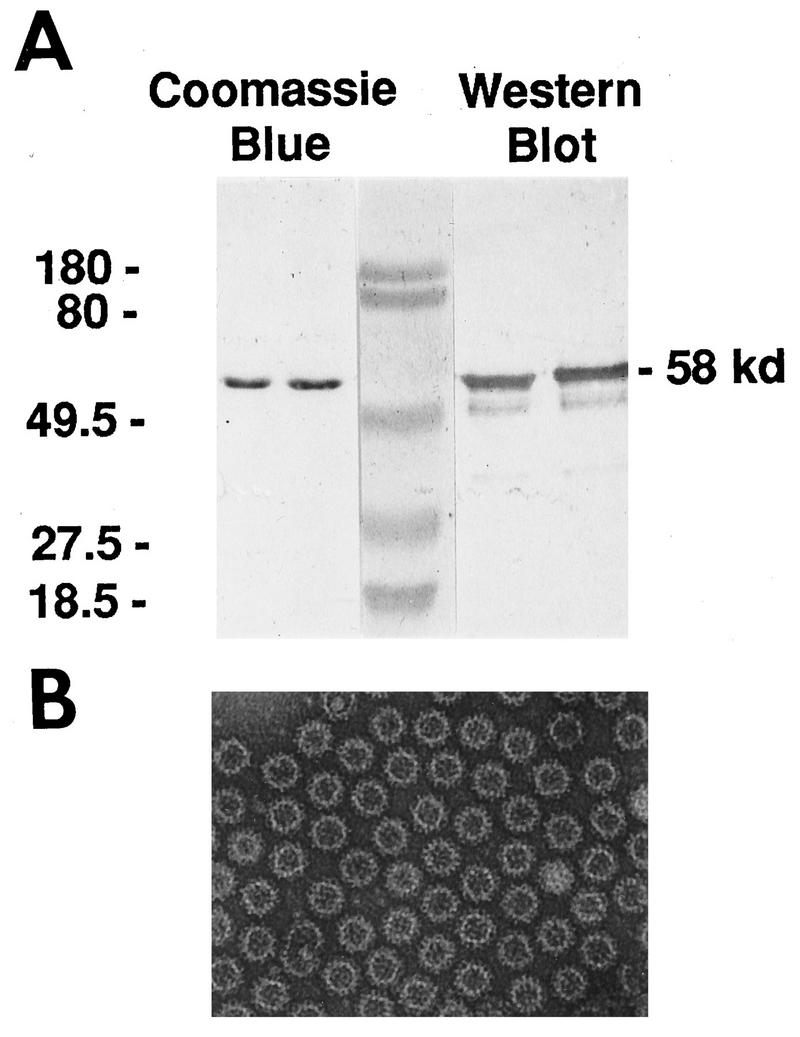
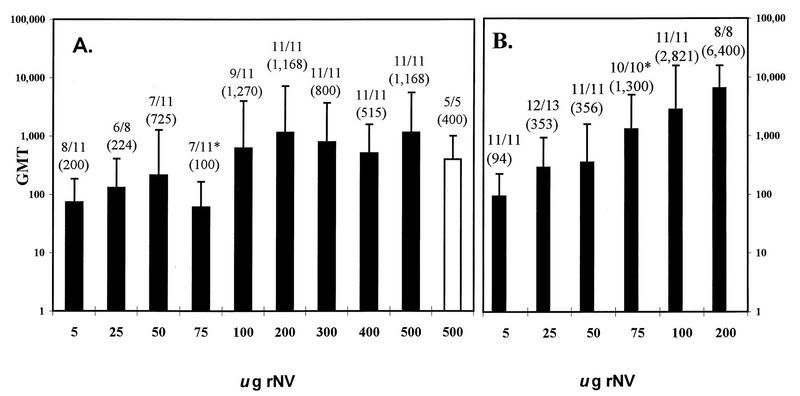
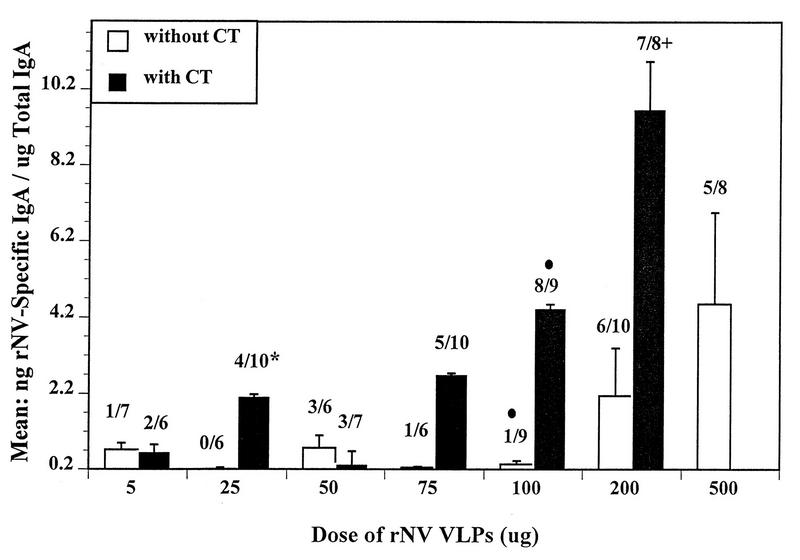
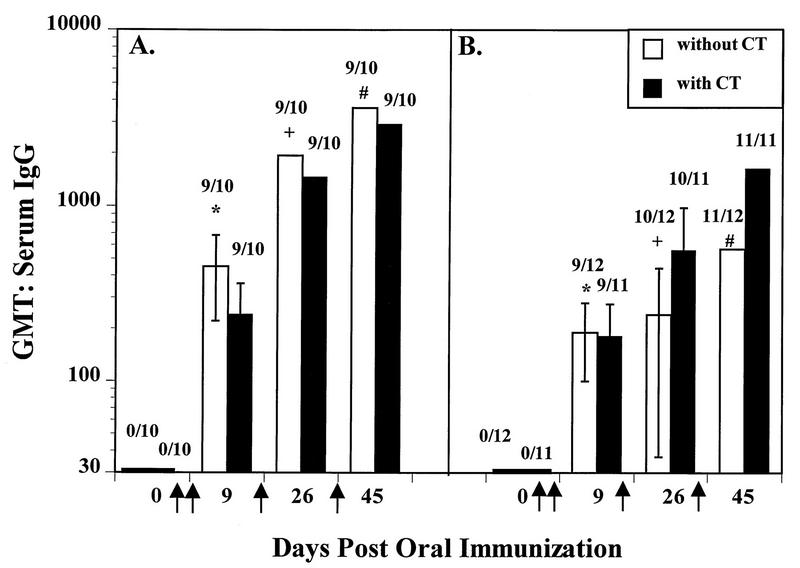
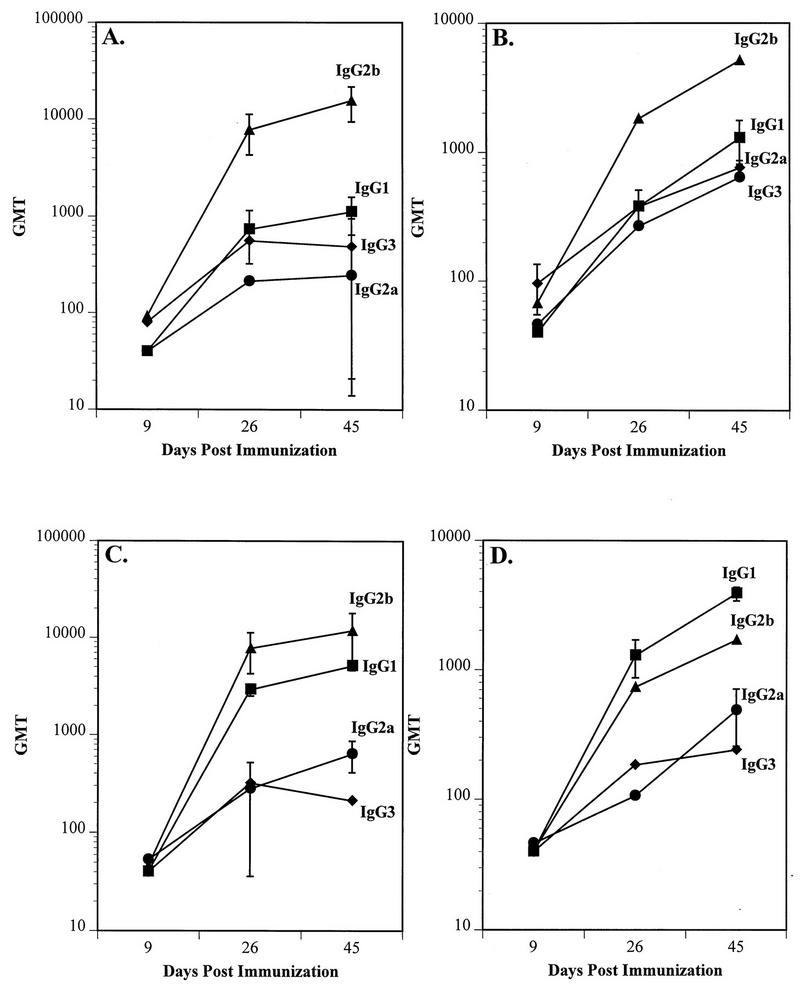
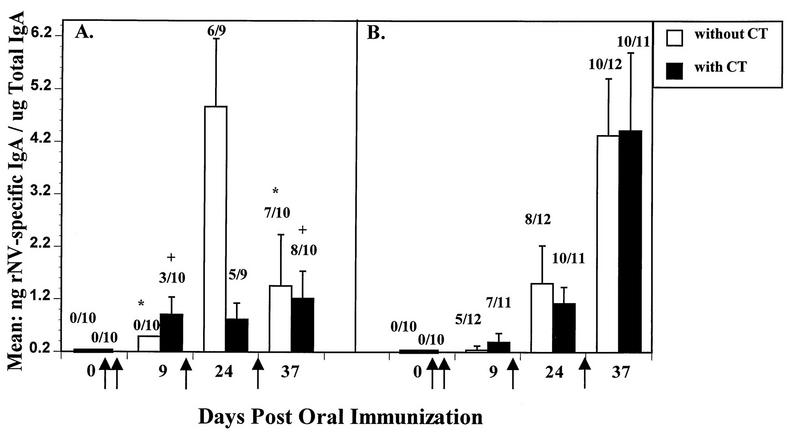
Recombinant Norwalk virus-like particles (rNV VLPs) produced in insect cells were evaluated as an oral immunogen in CD1 and BALB/c mice by monitoring rNV-specific serum total and subclass immunoglobulin G (IgG) and intestinal IgA responses. Dose and kinetics of response were evaluated in the presence and absence of the mucosal adjuvant cholera toxin (CT). rNV-specific serum IgG and intestinal IgA were detected in the absence of CT, and the number of responders was not significantly different from that of mice administered VLPs with CT at most doses. The use of CT was associated with induction of higher levels of IgG in serum; this effect was greater at higher doses of VLPs. IgG in serum was detected in the majority of animals by 9 days postimmunization (dpi), and intestinal IgA responses were detected by 24 dpi. In the absence of CT, IgG2b was the dominant IgG subclass response in both mouse strains. Thus, nonreplicating rNV VLPs are immunogenic when administered orally in the absence of any delivery system or mucosal adjuvant. These studies demonstrate that rNV VLPs are an excellent model to study the oral delivery of antigen, and they are a potential mucosal vaccine for NV infections.


Figures

FIG. 1
FIG. 1
Characterization of the rNV particles. (A) SDS-PAGE (10% polyacrylamide) and Western blot analyses of the baculovirus-expressed rNV capsid protein used in the oral immunization of outbred (CD1) and inbred (BALB/c) mice. The Coomassie blue-stained gel shows a single 58-kDa band corresponding to the NV capsid protein. Western blot analysis using mouse rNV-specific antiserum shows additional bands at 50K and 30K, cleavage products of the full-length capsid protein. The molecular weight markers are shown in the center lane, and the corresponding molecular weights are indicated on the left. (B) EM of rNV particles purified from infected Sf9 insect cells. The particles were purified by centrifugation through a step sucrose gradient (20 to 60%), diluted 1:10 in sterile MilliQ water, and stained with 1% ammonium molybdate, pH 6.0. Homogeneous rNV particles were present in each grid square.
FIG. 2
FIG. 2
The IgG responses in serum of CD1 mice to different doses of rNV VLPs orally administered in the absence (A) or presence (B) of CT, as measured by ELISA. The y axis shows the GMT of antibody for each group of animals, and the x axis shows the dose of VLPs orally administered by gavage on days 1, 2, 11, and 28. The open bar in panel A shows the results from a separate group of mice that received an alternate immunization schedule of two oral doses at a 3-week interval. Nonresponders were included in the calculations of the GMT. Above each bar is the number of responders over the total number of mice tested, and the GMT of only the responders is shown in parenthesis. Only one dose of rNV VLPs administered orally in the presence and absence of CT (75 μg) induced significantly different IgG responses when each dose was compared individually (P < 0.001 [∗], Student’s t test). Multiple linear regression showed that CT did influence the magnitude of the response at higher doses of VLPs. The error bars show the standard errors of the mean.
FIG. 3
FIG. 3
The intestinal IgA responses in CD1 mice to different doses of rNV particles orally administered in the presence or absence of CT. The concentration of VLPs given to each group of mice is shown in the x axis. Each dose was administered by gavage on days 1, 2, 11, and 28. Two independent ELISAs were used to measure the NV-specific and total IgA. The y axis shows the mean of the ratio in nanograms/milliliter of NV-specific IgA to micrograms/milliliter of total IgA or nanograms of specific IgA per microgram of total IgA. The number above each bar depicts the number of responders with detectable specific IgA over the total number of animals tested. The error bars show the standard errors of the mean. When NV-specific IgA was not detected, a value of 3.125 ng (one-half the lowest detectable level of specific IgA) was assigned to that sample, divided by the total IgA concentration, and used in the calculation of the mean and standard error. The number of responders to 100 μg of VLPs was significantly different when administered with or without CT (•) (P = 0.003, Fisher’s exact test). In the 25 μg of rNV dose with CT, one mouse had a ratio of 245 ng of rNV-specific IgA/μg of total IgA which was excluded in calculating the mean (∗). The mean is 26.4 when the 245 ratio is included. In the 200 μg of rNV dose with CT, one mouse had a ratio of 145 ng rNV-specific IgA/μg of total IgA which was excluded in calculating the mean (+). The mean is 29 when the 145 ratio is included.
FIG. 4
FIG. 4
The kinetics of serum IgG responses to the oral delivery of 200 μg of rNV VLPs with and without CT in outbred CD1 (A) and in inbred BALB/c (B) mice as measured by ELISA. The CD1 mice used in this experiment were an independent group of mice from those used for the data shown in Fig. 2 and 3. The y axis shows the GMT of serum IgG in samples taken on days 0, 9, 26, and 45 postimmunization (x axis). The VLPs were administered orally on days 1, 2, 11, and 28 (↑). Data shown are from the second, third, and fourth immunizations. Above each bar are the number of responders over the total number tested. The error bars show the standard errors of the mean. All calculations include the data from the nonresponders. Significant differences in the GMT were seen between the CD1 and BALB/c mice in the absence of CT (P = 0.044 [∗], P = 0.009 [+], P = 0.022 [#]; Student’s t test).
FIG. 5
FIG. 5
The kinetics of the serum IgG subclass response in CD1 (A and C) and BALB/c (B and D) mice to the oral administration of 200 μg of rNV particles in the absence (A and B) and the presence (C and D) of 10 μg of CT (data from testing all serum samples positive for rNV-specific total IgG from mice shown in Fig. 4). The x axis shows the days postimmunization, and the y axis shows the GMT of the IgG1, IgG2a, IgG2b, and IgG3 subclasses.
FIG. 6
FIG. 6
The kinetics of intestinal IgA responses to the oral delivery of 200 μg of rNV VLPs in the presence and absence of CT in CD1 (A) and BALB/c (B) mice. IgA levels were determined by two independent ELISAs which measured rNV-specific and total IgA, respectively. The y axis shows the mean of the ratios of rNV-specific IgA (expressed in nanograms/milliliter) to total IgA (expressed in micrograms/milliliter). The VLPs were administered orally on days 1, 2, 11, and 28 (↑). The numbers above each bar indicate the number of animals with detectable intestinal IgA over the total number of animals tested. The error bars depict the standard errors of the mean. When specific IgA was not detected, a value of 3.125 ng/ml (one-half the detectable level of specific IgA) was used in the calculation of the mean. Because the data are expressed as a ratio, there were instances in which samples that had detectable rNV-specific IgA calculated to a lower ratio than negative samples. This was seen at 9 dpi. The number of CD1 responders significantly increased after the last dose of VLPs (day 37) when compared to the number of responders at 9 dpi in the presence (P = 0.07 [+]) or absence (P = 0.02 [∗]) of CT. Sufficient fecal samples were not available for testing from some animals (day 0, panel B).

Similar articles

Cited by

References

    1. Bergmann K-C, Waldman R H. Stimulation of secretory antibody following oral administration of antigen. Rev Infect Dis. 1988;10:939–950. - PubMed
    1. Challacombe S J. Cellular factor in the induction of mucosal immunity by oral immunization. Adv Exp Med Biol. 1987;216b:887–899. - PubMed
    1. Coffman R L, Lebman D A, Shrader B. Transforming growth factor beta specifically enhances IgA production by lipopolysaccharide-stimulated murine B lymphocytes. J Exp Med. 1989;170:1039–1044. - PMC - PubMed
    1. Coutelier J-P, van der Logt J T M, Heessen F W A, Vink A, van Snick J. Virally induced modulation of murine IgG antibody subclasses. J Exp Med. 1988;168:2373–2378. - PMC - PubMed
    1. Coutelier J-P, van der Logt J T M, Heessen F W A, Warnier G, van Snick J. IgG2a restriction of murine antibodies elicited by viral infections. J Exp Med. 1987;165:64–69. - PMC - PubMed

Publication types

LinkOut - more resources