Clinical Trial
. 1998 Feb;72(2):1552-76.
doi: 10.1128/JVI.72.2.1552-1576.1998.

Immunological and virological analyses of persons infected by human immunodeficiency virus type 1 while participating in trials of recombinant gp120 subunit vaccines

Affiliations
Clinical Trial

Immunological and virological analyses of persons infected by human immunodeficiency virus type 1 while participating in trials of recombinant gp120 subunit vaccines

R I Connor et al. J Virol. 1998 Feb.

Abstract

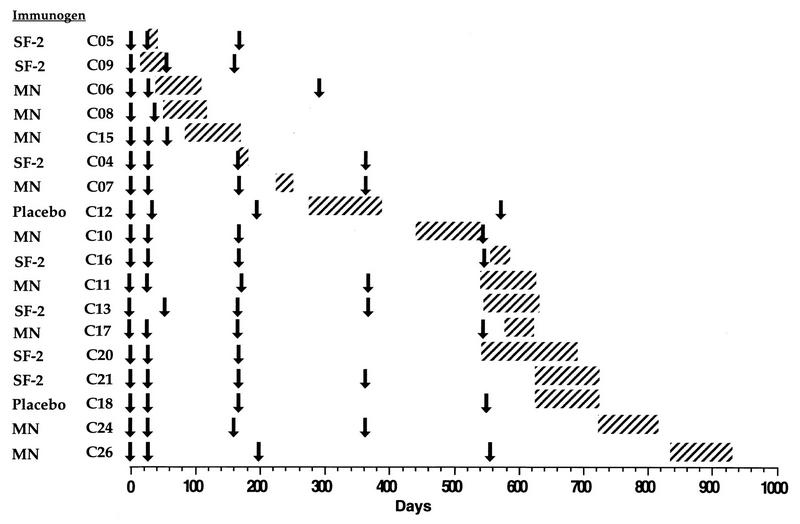
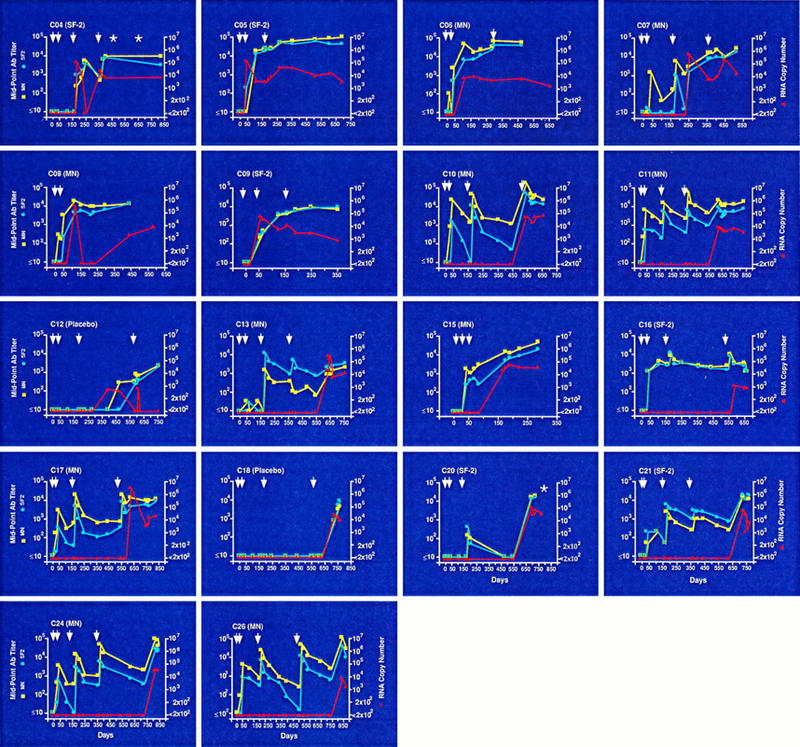
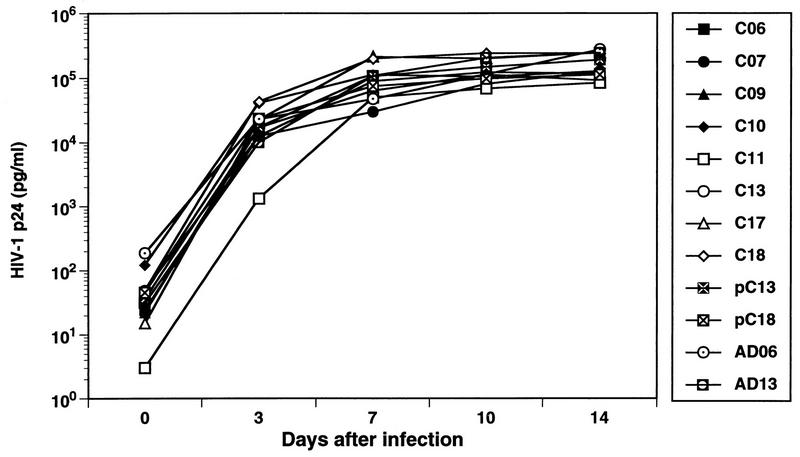
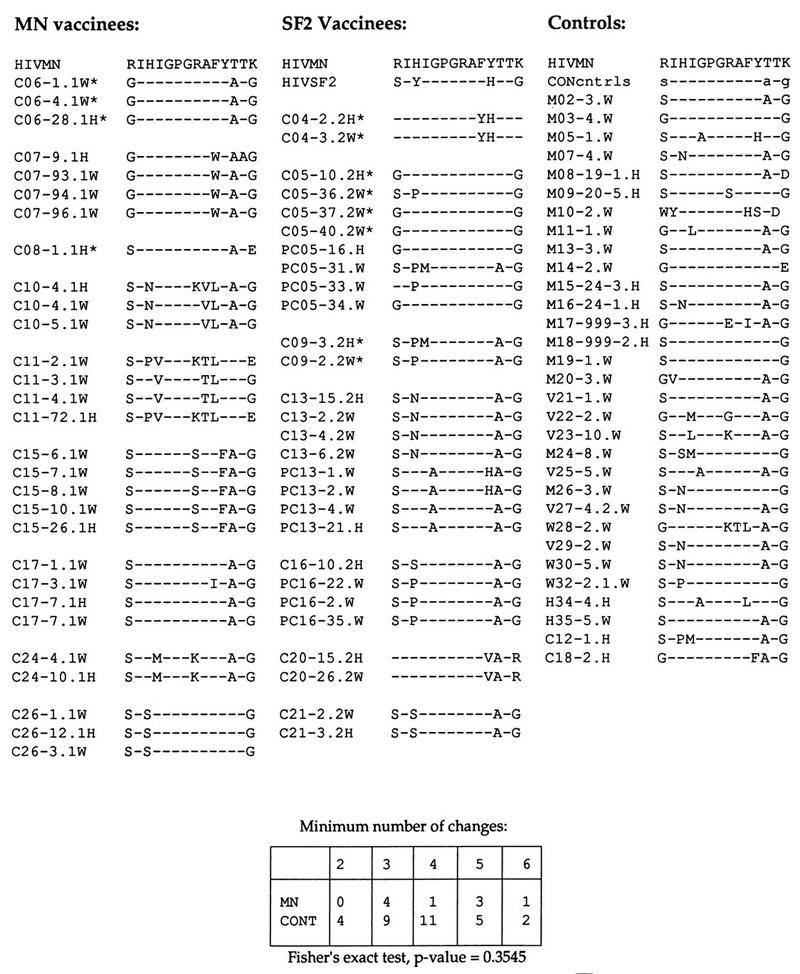
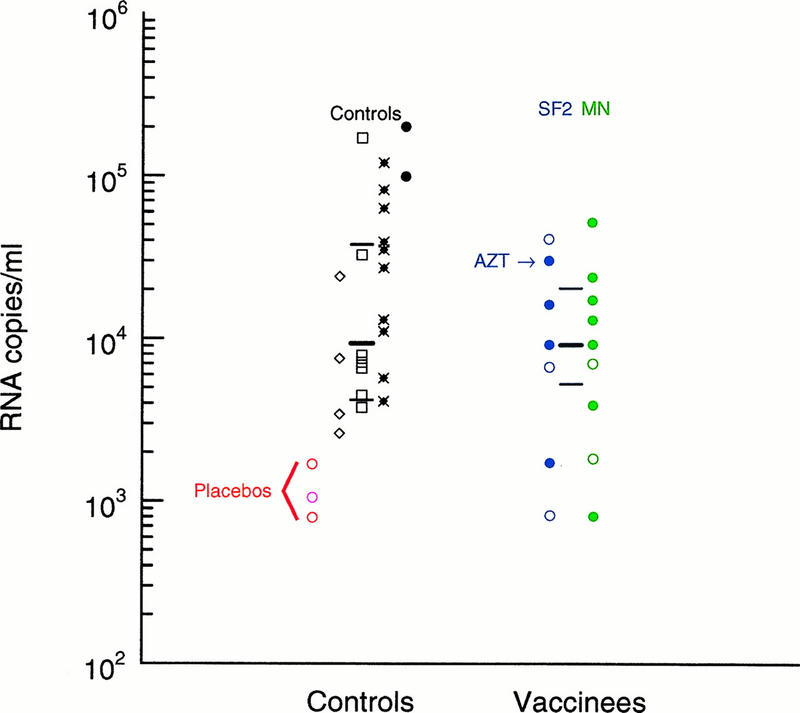
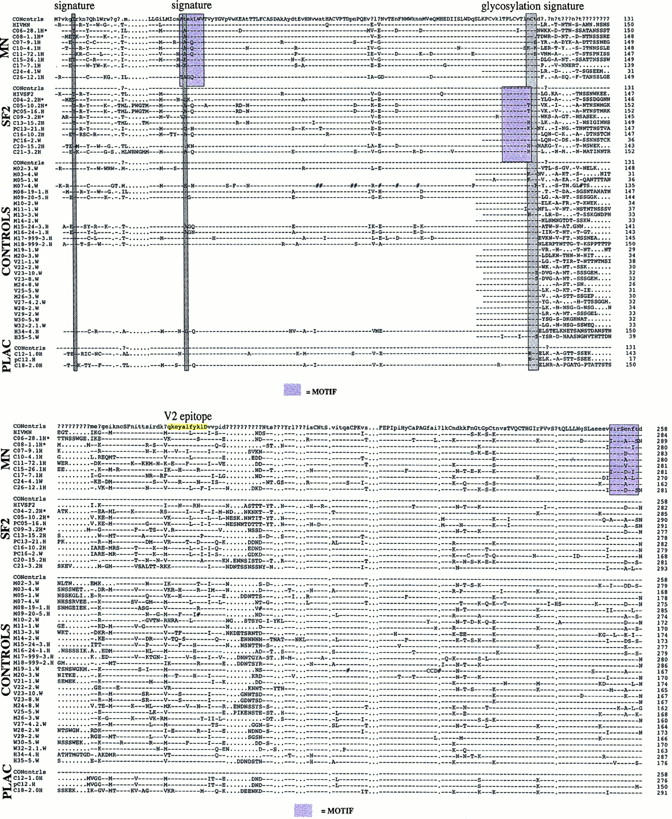
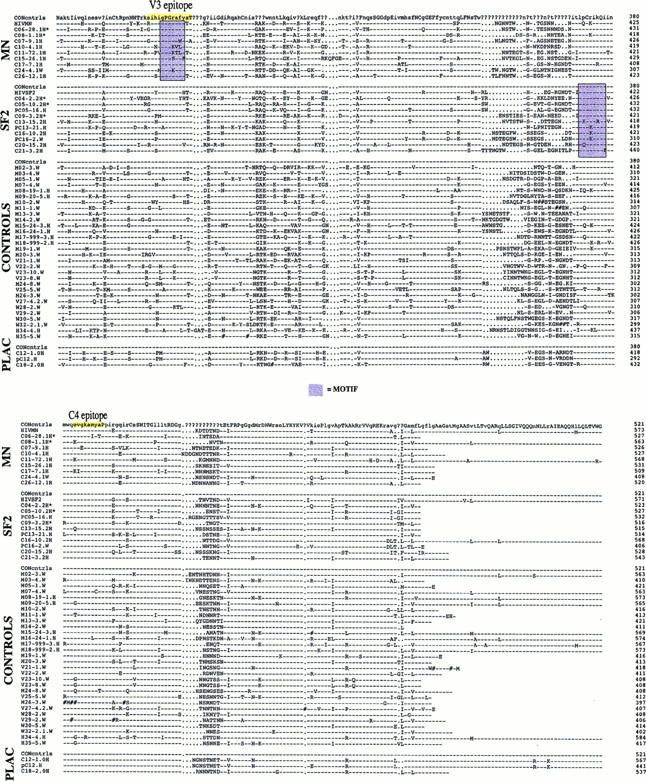
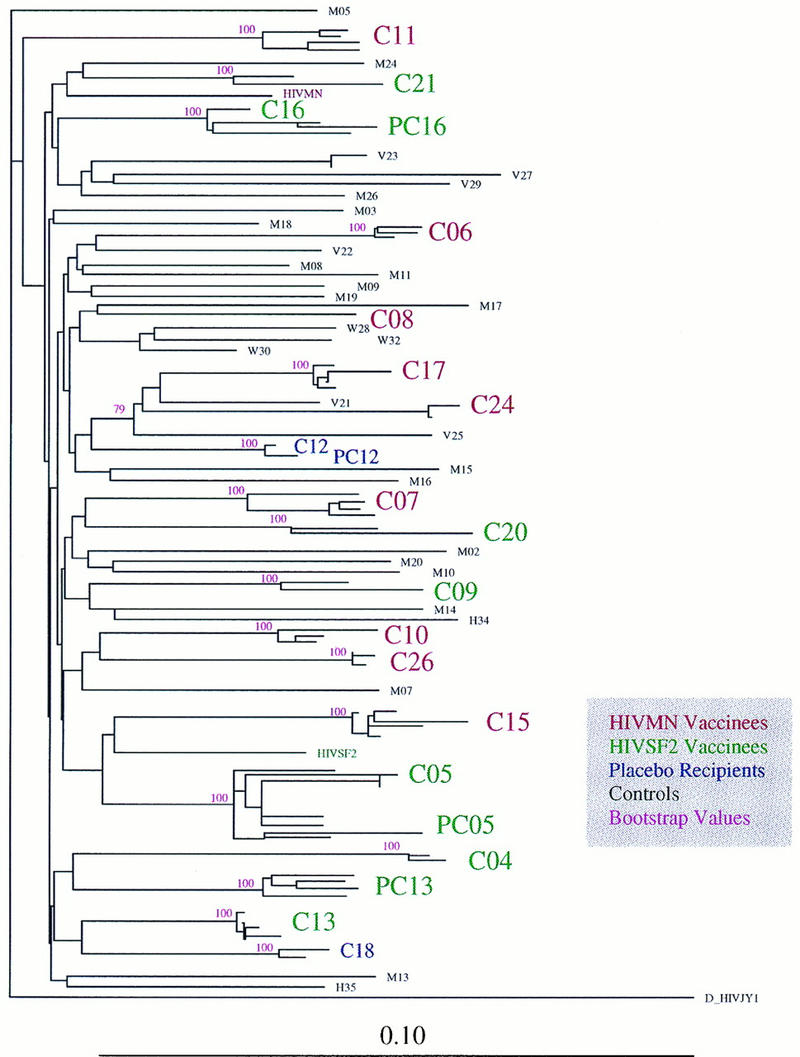
We have studied 18 participants in phase I/II clinical trials of recombinant gp120 (rgp120) subunit vaccines (MN and SF-2) who became infected with human immunodeficiency virus type 1 (HIV-1) during the course of the trials. Of the 18 individuals, 2 had received a placebo vaccine, 9 had been immunized with MN rgp120, and seven had been immunized with SF-2 rgp120. Thirteen of the 18 infected vaccinees had received three or four immunizations prior to becoming infected. Of these, two were placebo recipients, six had received MN rgp120, and five had received SF-2 rgp120. Only 1 of the 11 rgp120 recipients who had multiple immunizations failed to develop a strong immunoglobulin G antibody response to the immunogen. However, the antibody response to rgp120 was transient, typically having a half-life of 40 to 60 days. No significant neutralizing activity against the infecting strain was detected in any of the infected individuals at any time prior to infection. Antibody titers in subjects infected despite vaccination and in noninfected subjects were not significantly different. Envelope-specific cytotoxic T-lymphocyte responses measured after infection were infrequent and weak in the nine vaccinees who were tested. HIV-1 was isolated successfully from all 18 individuals. Sixteen of these strains had a non-syncytium-inducing (NSI) phenotype, while two had a syncytium-inducing (SI) phenotype. NSI strains used the CCR5 coreceptor to enter CD4+ cells, while an SI strain from one of the vaccinees also used CXCR4. Viruses isolated from the blood of rgp120 vaccinees were indistinguishable from viruses isolated from control individuals in terms of their inherent sensitivity to neutralization by specific monoclonal antibodies and their replication rates in vitro. Furthermore, genetic sequencing of the env genes of strains infecting the vaccinees did not reveal any features that clearly distinguished these viruses from contemporary clade B viruses circulating in the United States. Thus, despite rigorous genetic analyses, using various breakdowns of the data sets, we could find no evidence that rgp120 vaccination exerted selection pressure on the infecting HIV-1 strains. The viral burdens in the infected rgp120 vaccine recipients were also determined, and they were found to be not significantly different from those in cohorts of placebo-vaccinated and nonvaccinated individuals. In summary, we conclude that vaccination with rgp120 has had,to date, no obvious beneficial or adverse effects on the individuals we have studied.


Figures

FIG. 1
FIG. 1
Temporal relationship between entry into the vaccine trial, receipt of immunizations, and the period during which HIV-1 infection occurred. The date of entry (first immunization) into one of the vaccine trials is designated as day 0, and all time points represent days elapsed from that date. Arrows indicate days on which immunization occurred, and hatched bars correspond to the interval between the last negative and first positive HIV-1 RNA PCR result, based on measurement of viral RNA in plasma or serum. The cases are arranged in order of the time between commencement of immunization and the time of HIV-1 infection.
FIG. 2
FIG. 2
Longitudinal profiles of plasma viral burden, and antibody responses to MN and SF-2 rgp120, for the 18 infected vaccinees. Each panel represents one of the 18 infected vaccinees; the corresponding case number and respective immunogen are shown in the upper left-hand corner of each profile. The red triangles represent the level of plasma HIV-1 virion-associated RNA in copies per milliliter, the blue circles represent the midpoint antibody titers to SF-2 rgp120, and the yellow squares represent midpoint antibody titers to MN rgp120. Day 0 designates the date of entry into one of the vaccine trials, and all time points represent days elapsed from that point. The days on which immunizations were received are indicated by arrows. Four individuals (C04, C15, C20, and C26) received antiretroviral therapy following HIV-1 infection while still participating in a vaccine trial. The day(s) on which therapy was initiated is indicated by an asterisk. For two cases (C15 and C26), treatment was initiated after the last time point in which viral RNA levels and antibody responses were tested. C04 was treated with dideoxyinosine (beginning day 498) and AZT (beginning on day 658); C15 was treated with dideoxycytosine (beginning on day 490); C20 was treated with AZT (beginning on day 811); and C26 was treated with AZT, 3TC, and Retonavir (beginning on day 976).
FIG. 3
FIG. 3
Replication kinetics of viral isolates from infected vaccinees in activated PBMC. The replication kinetics of selected HIV-1 isolates from the infected vaccinees were evaluated in cultures of PHA-stimulated normal donor PBMC. Cells were infected with 100 TCID50 of each isolate, and the levels of HIV-1 p24 antigen were measured in culture supernatants on days 0, 3, 7, 10, and 14 after inoculation. Isolate pC13 is from the partner of C13; isolates AD6 and AD13 were obtained from nonvaccinated acute seroconvertors.
FIG. 4
FIG. 4
The antigenic domain in the V3 loop. All available sequences are included, grouped by individual, and aligned with the MN consensus sequence. An example of a matrix for a Fisher’s exact test, used to examine the possibility of greater diversity in the MN recipient strains relative to MN compared to the control (CONT) set, is shown at the bottom. The number of amino acid changes relative to the vaccine strain sequence for the closest sequence in each of the vaccinees and for each of the controls was tallied (138, 139). For example, C06 had three changes relative to MN in this region. The number of individuals with viruses carrying a given number of mutations was tallied for the MN vaccine recipient group and for the controls, and the two groups were not significantly different by this measure. The positions that tend to correlate with the SI phenotype are the first and last amino acids of this region, and the two SI isolates from among the vaccine recipients (C04 and C20) carry positively charged arginine and lysine residues in these positions, respectively. Dashes indicate gaps in the sequence alignments.
FIG. 5
FIG. 5
Comparison of the viral loads of infected vaccinated individuals and matched controls at 9 to 12 months after the estimated time of infection. Viral RNA copy numbers in sera or plasma from HIV-1 infected individuals who had been given an SF2 rgp120 vaccine are labeled in blue, and those who had received MN rgp120 are in green. Individuals who had received three or four vaccinations prior to infection are indicated by closed circles; those who had less than three vaccinations are indicated by open circles. The single individual who had documented antiretroviral agent (AZT) use prior to this sampling period is indicated with an arrow. In cases for which two samples from a single individual were available during this 3-month period, the average value was used. Twenty-three controls matched for risk factors for infection, gender, age (±10 years), and year of seroconversion were obtained from four different cohorts, excluding samples that were derived from patients with prior use of antiretroviral agents and patients for whom no samples were available in the appropriate time frame of 9 to 12 months postseroconversion. Three samples from individuals given placebo vaccinations prior to infection were included with the controls and are marked as open circles in the first column of controls. The red circles are for placebo recipients from the 401 study, and the pink circle is a placebo recipient from another U.S. vaccine trial. The other four columns display control RNA values from the four different cohorts: the TRUNK cohort (◊), the ALIVE cohort (□), the MACS cohort (•×), and HIVNET (•). The medians and interquartile ranges for the complete control set and the complete vaccine recipient set are indicated by the thick and thin horizontal black bars, respectively.
FIG. 6
FIG. 6
Amino acid alignment of gp120 protein sequences. Only a single sequence is shown per individual vaccine recipient, although multiple sequences were determined. Yellow boxes indicate antigenic regions in V2, V3, and C4 that were analyzed in detail. Gray shading indicates distinctive amino acid signature sites. Purple boxes indicate the most distinctive motifs identified with MotifScan. All sequences are aligned to the consensus sequence of the control set, labeled CON. The sequence designations include the study subject identification number, the clone number, and either an H (if sequenced at the University of Alabama at Birmingham) or a W (if sequenced at Northwestern University). Dashes indicate identity with the B subtype sequence at the top of the alignment; periods indicate insertions made to maintain the alignment; pound signs indicate frameshift mutations.
FIG. 6
FIG. 6
Amino acid alignment of gp120 protein sequences. Only a single sequence is shown per individual vaccine recipient, although multiple sequences were determined. Yellow boxes indicate antigenic regions in V2, V3, and C4 that were analyzed in detail. Gray shading indicates distinctive amino acid signature sites. Purple boxes indicate the most distinctive motifs identified with MotifScan. All sequences are aligned to the consensus sequence of the control set, labeled CON. The sequence designations include the study subject identification number, the clone number, and either an H (if sequenced at the University of Alabama at Birmingham) or a W (if sequenced at Northwestern University). Dashes indicate identity with the B subtype sequence at the top of the alignment; periods indicate insertions made to maintain the alignment; pound signs indicate frameshift mutations.
FIG. 7
FIG. 7
Vaccine breakthrough sequences and controls: neighbor-joining phylogenetic tree, with bootstrap values, showing the relationships between the viral sequences from vaccinated individuals and matched controls. Partners of vaccinated individuals are indicated with a P (e.g., C05 and PC05 are vaccinee C05 and C05’s partner, respectively). Bootstrap values of greater than 50 are shown. Vaccine strains MN and SF2 are included. A D subtype viral sequence was used as an outgroup. Multiple sequences for the vaccinees and their partners are included, and all sequences from the same patient cluster in 100 of 100 bootstrap resampling replicates.

Similar articles

Cited by

References

    1. Allaway G P, Davis-Bruno K L, Beaudry G A, Garcia E B, Wong E L, Ryder A M, Hasel K W, Gauduin M-C, Koup R A, McDougal J S, Maddon P J. Expression and characterization of CD4-IgG2, a novel heterotetramer which neutralizes primary HIV-1 isolates. AIDS Res Hum Retroviruses. 1995;11:533–540. - PubMed
    1. Altschul S F, Gish W, Miller W, Myers E W. Basic local alignment search tool. J Mol Biol. 1990;215:403–410. - PubMed
    1. Artenstein A W, VanCott T C, Sitz K V, Robb M L, Wagner K F, Veit S C D, Rogers A F, Garner R P, Byron J W, Burnett P R, Birx D L. Mucosal immune responses in four distinct compartments of women infected with human immunodeficiency virus type 1: a comparison by site and correlation with clinical information. J Infect Dis. 1997;175:265–271. - PubMed
    1. Åsjö B, Morfeldt-Månson L, Albert J, Biberfeld G, Karlsson A, Lidman K, Fenyö E M. Replicative capacity of human immunodeficiency virus from patients with varying severity of HIV infection. Lancet. 1986;i:660–662. - PubMed
    1. Baenziger J, Liu Y, Walker C. Proceedings of the Seventh Annual Meeting of the National Cooperative Vaccine Development Groups for AIDS, Reston, Va. 1994. Cytotoxic T lymphocyte (CTL) responses in baboons and humans immunized with a recombinant HIV-1 gp120 vaccine; p. 88.

Publication types

MeSH terms

Associated data