Review
. 1998 Feb 3;95(3):765-72.
doi: 10.1073/pnas.95.3.765.

Behind the scenes of functional brain imaging: a historical and physiological perspective

Affiliations
Review

Behind the scenes of functional brain imaging: a historical and physiological perspective

M E Raichle. Proc Natl Acad Sci U S A. .

Abstract

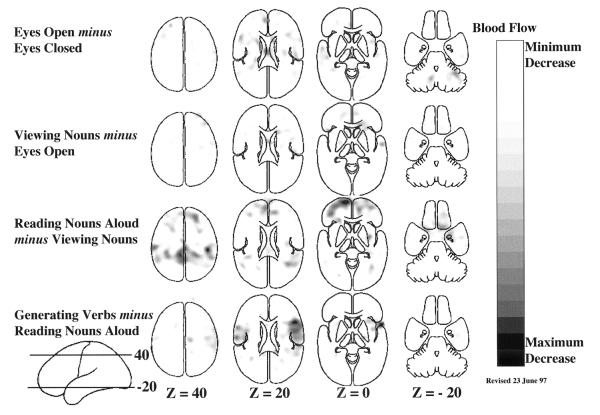
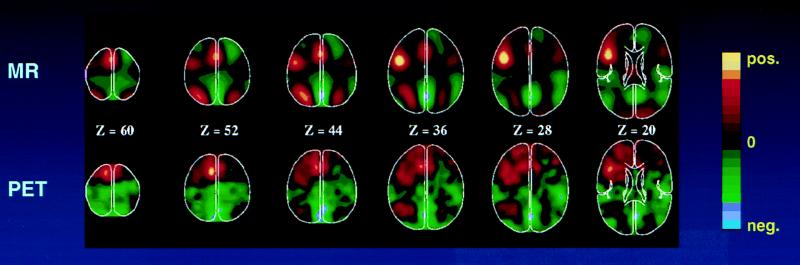
At the forefront of cognitive neuroscience research in normal humans are the new techniques of functional brain imaging: positron emission tomography and magnetic resonance imaging. The signal used by positron emission tomography is based on the fact that changes in the cellular activity of the brain of normal, awake humans and laboratory animals are accompanied almost invariably by changes in local blood flow. This robust, empirical relationship has fascinated scientists for well over a hundred years. Because the changes in blood flow are accompanied by lesser changes in oxygen consumption, local changes in brain oxygen content occur at the sites of activation and provide the basis for the signal used by magnetic resonance imaging. The biological basis for these signals is now an area of intense research stimulated by the interest in these tools for cognitive neuroscience research.


Figures

Figure 1
Figure 1
Four different hierarchically organized conditions are represented in these mean blood flow difference images obtained with PET. All of the changes shown in these images represent increases over the control state for each task. A group of normal subjects performed these tasks involving common English nouns (40, 83, 84) to demonstrate the spatially distributed nature of the processing by task elements going on in the normal human brain during a simple language task. Task complexity was increased from simply opening the eyes (row 1) through passive viewing of nouns on a television monitor (row 2); reading aloud the nouns as they appear on the screen (row 3); and saying aloud an appropriate verb for each noun as it appeared on the screen (row 4). These horizontal images are oriented with the front of the brain on top and the left side to the reader’s left. The markings “Z = 40” indicate millimeters above and below a horizontal plane through the brain marked “Z = 0”.
Figure 2
Figure 2
Hierarchically organized subtractions involving the same task conditions as shown in Fig. 1 with the difference being that these images represent areas of decreased activity in the task condition as compared with the control condition. Note that the major decreases occurred when subjects read the visually presented nouns aloud as compared with viewing them passively as they appeared on the television monitor (row 3); and when they said aloud an appropriate verb for each noun as it appeared on the television monitor as compared with reading the noun aloud (row 4). Combining the information available in Figs. 1 and 2 provides a fairly complete picture of the interactions between tasks and brain systems in hierarchically organized cognitive tasks when studied with functional brain imaging.
Figure 3
Figure 3
Practice-induced changes in brain systems involve both the disappearance of activity in systems initially supporting task performance (row 1) and the appearance of activity in other systems concerned with practiced performance (row 2). In this example, generating verbs aloud for a visually presented nouns (see also row 4 of Figs. 1 and 2 for changes during the naïve performance of the task), subjects acquired proficiency on the task after 10 min of practice. This improved performance was associated with a disappearance of activity in areas of frontal and temporal cortex and the right cerebellum (row 1) and the appearance of activity in Sylvian-insular and occipital cortex (row 2). These images were created by subtracting the naïve performance of verb generation from the practiced performance of the task. More details on these changes can be obtained from Raichle et al. (40).
Figure 4
Figure 4
Functional images obtained with PET and fMRI represent comparisons between two conditions usually referred to as a control state and a task state. The task state is designed to contain specific mental operations of interest. Because the task state invariably contains additional mental operations not of interest, a control state is selected which contains those operations to be ignored yet does not contain the operations of interest in the task state. Depending on the actual changes in brain activity in each state and the comparison made between states, the resulting changes depicted in the functional image will have either a positive (Fig. 1) or negative (Fig. 2) sign. This figure is designed to illustrate how the sign (i.e., positive or negative change) arises from the primary image data. Absolute changes (Absolute Magnitudes) are represented on the left for a hypothetical area in the brain as monitored by either PET or fMRI. The horizontal axis on the left represents four states studied in the course of a hypothetical imaging experiment. An Absolute Magnitude above the horizontal axis (A) represents an increase over the other states studied whereas an Absolute Magnitude below this axis (B) represents a decrease. The comparisons (i.e. 2-1, 3-2, and 4-3) leading to the functional images themselves are shown on the right (Difference Magnitudes). It should be appreciated from this figure that the sign of the change in the functional image is dependent on both the change in activity within an area during a particular task (Absolute Magnitudes) and the particular comparison subsequently made between states (Difference Magnitudes). These general principles should be kept in mind when evaluating data of the type shown in Figs. 1–3.
Figure 5
Figure 5
fMRI (Upper) of the BOLD signal (4) and PET (Lower) images of blood flow change. These images were obtained during the performance of a task in which subjects viewed three letter word stems and were asked to speak aloud (PET) or think silently (fMRI) the first word to come to mind whose first three letters corresponded to the stems [e.g., see cou, say or think couple (85)]. The color scale employed in these images shows activity increases in reds and yellows and activity decreases in greens and blues. Note that both PET and fMRI show similar increases as well as decreases. The fMRI images were blurred to the resolution of the PET images (18 mm full width at half maximum) to facilitate comparison.
Figure 6
Figure 6
A summary of currently available data on the relationship of blood flow, glucose utilization, and oxygen consumption to the cellular activity of the brain during changes in functional activity is shown in this figure. The changes occurring in blood flow and glucose utilization exceed changes in oxygen consumption. The degree to which oxygen consumption actually changes, if at all, remains to be determined. PET measures the changes in blood flow. fMRI measures a BOLD (4) signal or contrast that arises when changes in blood flow exceed changes in tissue oxygen consumption.

References

    1. Raichle M E. In: Handbook of Physiology: The Nervous System V: Higher Functions of the Brain. Plum F, editor. Bethesda, MD: Am. Physiol. Soc.; 1987. pp. 643–674.
    1. Fox P T, Raichle M E. Proc Natl Acad Ssi USA. 1986;83:1140–1144. - PMC - PubMed
    1. Fox, P. T., Raichle, M. E., Mintun, M. A. & Dence, C. (1988) Science 241. - PubMed
    1. Ogawa S, Lee T M, Kay A R, Tank D W. Proc Natl Acad Sci USA. 1990;87:9868–9872. - PMC - PubMed
    1. Ogawa S, Tank D W, Menon R, Ellermann J M, Kim S-G, Merkle H, Ugurbil K. Proc Natl Acad Sci USA. 1992;89:5951–5955. - PMC - PubMed

Publication types

LinkOut - more resources