Review
. 1998 Feb 3;95(3):818-24.
doi: 10.1073/pnas.95.3.818.

The representation of the ipsilateral visual field in human cerebral cortex

Affiliations
Review

The representation of the ipsilateral visual field in human cerebral cortex

R B Tootell et al. Proc Natl Acad Sci U S A. .

Abstract

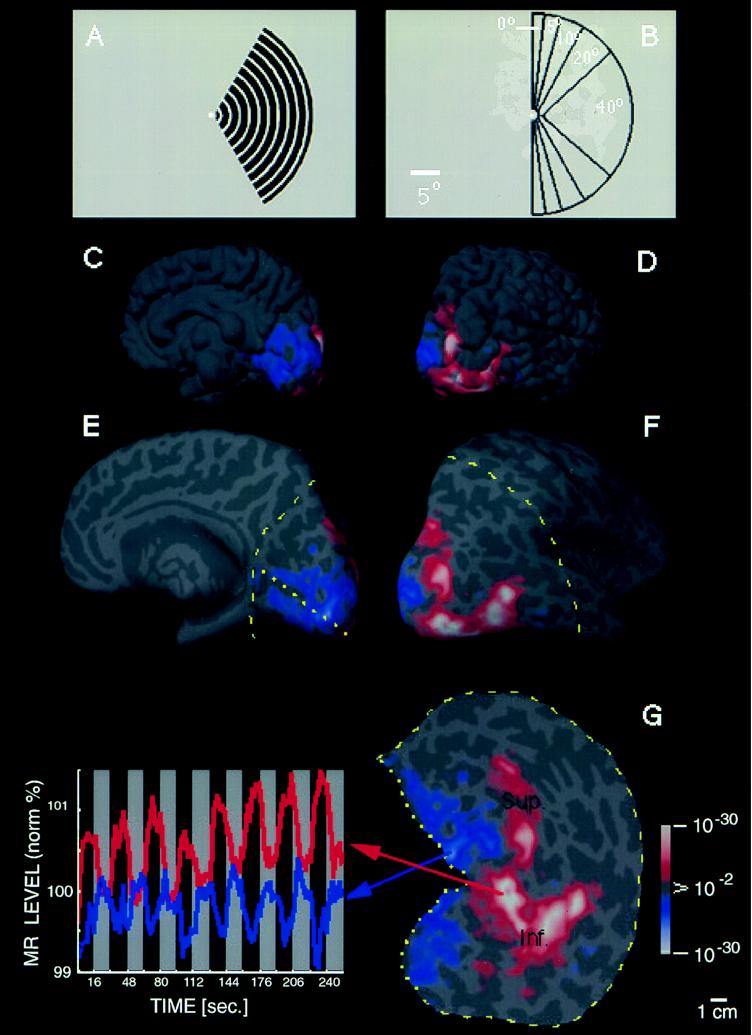
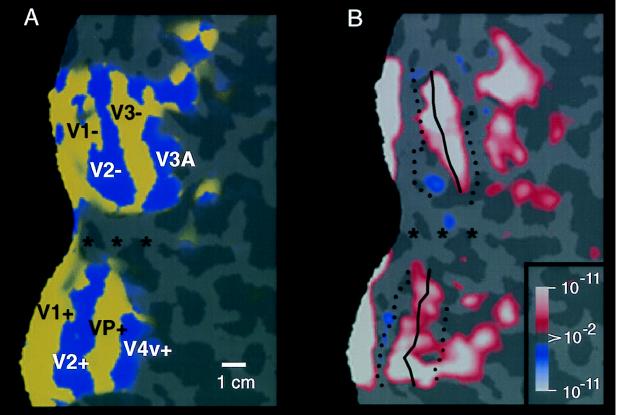
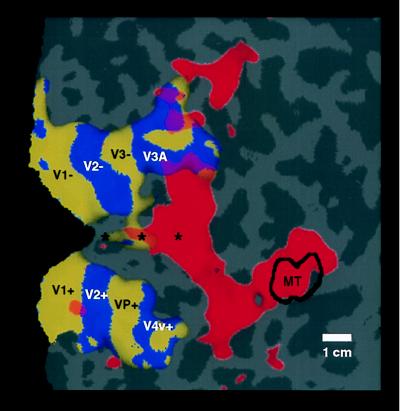
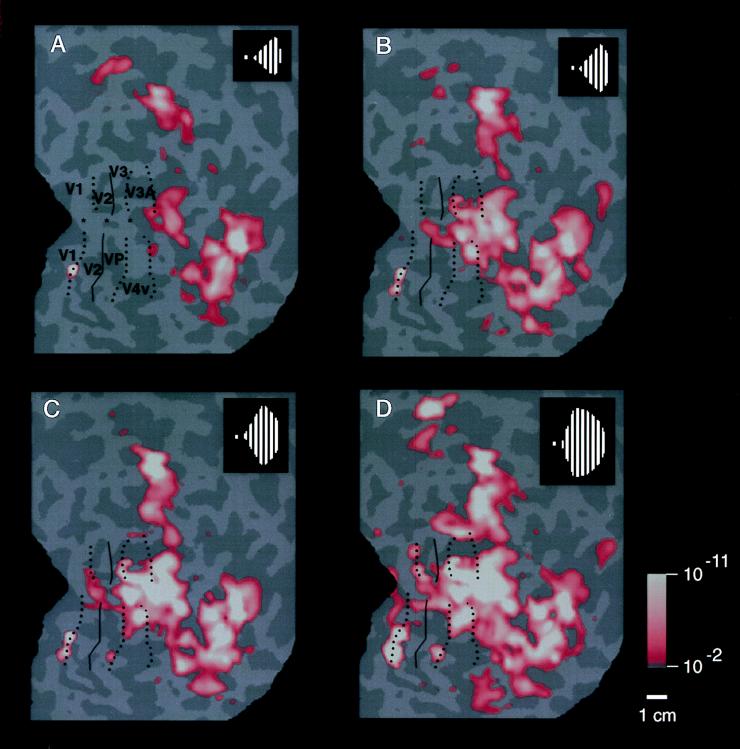
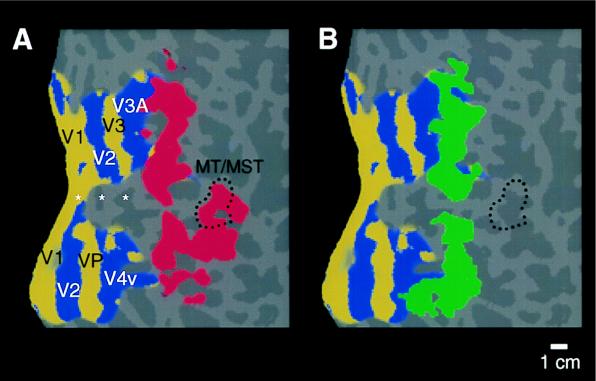
Previous studies of cortical retinotopy focused on influences from the contralateral visual field, because ascending inputs to cortex are known to be crossed. Here, functional magnetic resonance imaging was used to demonstrate and analyze an ipsilateral representation in human visual cortex. Moving stimuli, in a range of ipsilateral visual field locations, revealed activity: (i) along the vertical meridian in retinotopic (presumably lower-tier) areas; and (ii) in two large branches anterior to that, in presumptive higher-tier areas. One branch shares the anterior vertical meridian representation in human V3A, extending superiorly toward parietal cortex. The second branch runs antero-posteriorly along lateral visual cortex, overlying motion-selective area MT. Ipsilateral stimuli sparing the region around the vertical meridian representation also produced signal reductions (perhaps reflecting neural inhibition) in areas showing contralaterally driven retinotopy. Systematic sampling across a range of ipsilateral visual field extents revealed significant increases in ipsilateral activation in V3A and V4v, compared with immediately posterior areas V3 and VP. Finally, comparisons between ipsilateral stimuli of different types but equal retinotopic extent showed clear stimulus specificity, consistent with earlier suggestions of a functional segregation of motion vs. form processing in parietal vs. temporal cortex, respectively.


Figures

Figure 1
Figure 1
Unilateral stimuli used in these experiments (A and B) and the topography of MR activity produced by one of these stimuli in the ipsilateral hemisphere (C–G). (A) A representative stimulus: a moving (7°/sec), rectangular wave radial grating (0.5 cycles/degree, duty cycle = 0.2), confined to a fixed sector on either the right (as in A) or left side of a fixation point. (B) A diagram of the full range of sector sizes used: in different scans, stimuli spared the vertical meridian by either 0°, 5°, 10°, 20°, or 40° of polar angle. The stimulus in A spares the vertical meridian by 20° of polar angle. Calibration bar = 5° of visual angle. (C–G) Cortical activity produced in a representative ipsilateral hemisphere (subject AL) by the stimulus in A. Activity is shown in different views, including the normal, folded cortex (C and D), and in an “inflated” cortical format (E and F) that shows activity normally hidden in cortical sulci. C and E are taken from a posterior-medial viewpoint, and D and F are taken from a posterior-lateral viewpoint. The ipsilateral activation and anatomical topography is more fully revealed in flattened cortical format (G), including posterior (visual) cortex. The arbitrary cut lines in the cortical surface are indicated by yellow lines (E–G: dotted = cut along the calcarine fissure; dashed = cut along the lateral surface). The pseudocolor scale bar indicates the statistical significance of the fMRI activity, based on an f-test. Increased MR signals in phase with grating presentation (i.e., conventional fMRI activity) range from a display threshold of P > 0.01 (red) to a maximum of P > 10−30 (white, surrounded by red). Regions of decreased MR signal during grating presentation are coded with an inverted color scale, from P > 0.01 (blue) to P > 10−30 (white, surrounded by blue). Maximum significance levels are relatively high partly because the data represents an average of eight identical scans (16,384 images total). The scale bar represents 1 cm (uncorrected for distortion) in the flattened image (G), 8 mm (E and F), and 6.7 mm (C and D). Although no stimulus appeared in the visual hemifield contralateral to this hemisphere at any time, there was significant positive fMRI activity (coded in red through white) in a bifurcating pattern on the lateral surface of the ipsilateral hemisphere (D, F, and G). From a common origin just lateral to the posterior pole, the superior branch (sup.) extends toward the superior terminus of the parieto-occipital fissure, and the inferior branch (inf.) runs antero-posteriorly along the inferior lateral surface. The ipsilateral stimulus also produces weaker, but statistically significant, decreases in MR level (blue through white) in the medial bank, where V1, V2, and other retinotopically specific areas are known to be located (refs. –; see also Figs. 3 and 4). In corresponding regions of the contralateral hemisphere (see Fig. 2B), this unilateral stimulus produces robust increases in cortical activity, consistent with the known contralateral retinotopy. These activity maps were clarified by displaying the time course of MR changes from two regions of interest in this hemisphere. In the graph (Lower Left), the interhemispheric stimuli were presented during 16-sec epochs (black stripes), separated by epochs of stimulation with a uniform gray field (gray stripes). One time course is taken from the region showing the bifurcating MR-positive (red-white) responses during presentation of the interhemispheric stimuli (region indicated with red arrow). The other time course is taken from those regions (primarily in the medial bank) that show MR-negative changes (blue-white, indicated by blue arrow) during presentation of the interhemispheric stimuli, relative to intervening, uniform gray control stimuli.
Figure 2
Figure 2
Retinotopic specificity of one of our unilateral stimuli in the contralateral (control) hemisphere. (A) Area boundaries based on the contralateral retinotopic map in one hemisphere (subject BK), produced by “thin” versions of bilateral, phase-encoded stimuli described earlier (24). (B) The effect of one of the present stimuli, avoiding the vertical meridian by 40°, in the same (contralateral) hemisphere of that subject, acquired during a different scan. As one would predict from the retinotopic map and from the present stimulus geometry (assuming stable fixation), the present stimulus produces robust activation within much of areas V1, V2, V3, VP, V3A, and V4v, including the representation of the contralateral horizontal meridian representations (solid lines). Activity also is concentrated toward the left border of the flattened map, which also coincides with a horizontal meridian representation in the midline of primary visual cortex. However, little or no activation was produced along the representation of the vertical meridia (dashed lines), nor along the foveal representation (∗). These features are consistent with the geometry of the contralateral stimulus, which also spared the vertical meridian and foveal representation, but included the horizontal meridian region. These results also confirmed the stability of fixation during the experiment. The other stimuli in this set, which encroached progressively closer to the vertical meridian, produced correspondingly more “filling in” of the vertical meridian representations; this finding is also consistent with the contralateral retinotopy (–31). The pseudocolor activity representation is similar to that in Fig. 1. Increased MR signals in phase with grating presentation range from a display threshold of P > 0.01 (red) to a maximum of P > 10−11 (white, surrounded by red). Regions of decreased MR signal level during grating presentation are rare in this hemisphere, but coded with a symmetrical color scale, from P > 0.01 (blue) to a minimum of P > 10−11 (white, surrounded by blue). This data and data in subsequent figures are based on single scans (2,048 images), so maximal significance levels are correspondingly lower than those in Fig. 1. The location of sulci and gyri in the normal, folded cortical state are represented here in dark and light gray, respectively. The calibration bar represents 1 cm, without distortion correction; the distortion correction varies locally in the flattened maps but it typically averages +/− 15%.
Figure 3
Figure 3
Topographical relationship between cortical areas manifesting contralateral (classical) retinotopy, compared with regions showing ipsilateral activity. Both patterns were produced and are displayed in the right hemisphere (subject LK). The ipsilateral activity (shown in red) was produced by the stimulus in Fig. 1A. The contralateral activity (yellow and blue) was produced by “thin” rings and rays, as described elsewhere (24). Regions showing significant contralateral retinotopy with polarity similar to that in the visual field are shown in yellow, and regions showing significant mirror-symmetric contralateral retinotopy are shown in blue. Other flattened format conventions are as described in accompanying figures.
Figure 4
Figure 4
Range of activity produced by stimuli of systematically varied extent in the ipsilateral visual field. Stimuli such as that in Fig. 1A were presented within a range of sector sizes (shown in Fig. 1B) in one representative ipsilateral hemisphere (subject JM). The stimulus was displaced from the vertical meridian by 40° of polar angle in A, 20° in B, 10° in C, and 5° in D (see logos). Visual cortical area borders, revealed in the same hemisphere by tests of contralateral retinotopy, are indicated for comparison. Representations of the contralateral horizontal meridian are indicated by solid lines, and representations of the vertical meridia are indicated by dashed lines. The pseudocolor activity scale bar is as described above, except that MR decreases are not shown, for simplicity. In general, cortical activity increased as the stimulus encroaches progressively closer to the vertical meridian. Within early retinotopic areas, such as the border between V1 and V2 (especially C and D), activity appeared first at the representation of the vertical meridian. Ipsilateral activity was correspondingly lacking at area borders corresponding to the contralateral horizontal meridian, such as the borders between V2/V3 and V2/VP. There were also distinct differences between areas in the degree of ipsilateral activation: across a significant range of stimulus extent (5–20° in this example), areas V3A and V4v showed more widespread ipsilateral activation than immediately adjacent areas V3 and VP. Furthermore, the activity in V3A and V4v extended well beyond the vertical meridian representations of these areas, even though these areas show clear contralateral retinotopy in other tests. The differences in ipsilateral fMRI topography between lower (e.g., V1, V2, and V3/VP) vs. presumably higher-tier (e.g., V3A and V4v) retinotopic areas is consistent with the presence of larger receptive fields in the latter. This evidence for larger receptive fields in V3A/V4v is also consistent with other human fMRI (24) and macaque electrophysiology (40).
Figure 5
Figure 5
Comparison of the ipsilateral activity produced by two different stimuli, within the same unilateral aperture. (A) The typical pattern of activation produced by the moving gratings, in the ipsilateral aperture shown in Fig. 1A (20° in polar angle from the vertical meridian). Significant ipsilateral activity is coded red, and the retinotopic field sign map from the same hemisphere is shown in yellow/blue. As described earlier, this stimulus produces a bifurcating pattern concentrated anterior to V3A/V4v, with the lower branch extending through MT. (B) Data from a similar experiment in the same hemisphere, with the same field sign map for comparison. In this second experiment, naturalistic images were presented within the same ipsilateral apertures, again avoiding the vertical meridian by 20° of polar angle. Activity in response to this stimulus is thresholded as in A and coded green. The upper branch of both ipsilateral activity patterns is similar. However, the lower branch of activity produced by the naturalistic stimuli does not extend anteriorly through MT. Instead it extends further inferior (downward in the figure), compared with that produced by the moving gratings in the same apertures. Similar differences were seen in all subjects tested with these two stimuli.

Similar articles

Cited by

References

    1. Dow B M, Snyder A Z, Vautin R G, Bauer R. Exp Brain Res. 1981;44:213–228. - PubMed
    1. Tootell R B H, Siverman M, S, Hamilton S L, Switkes E. J Neurosci. 1988;8:1531–1568. - PMC - PubMed
    1. Zeki S. Brain Res. 1970;19:63–75. - PubMed
    1. Van Essen D C, Zeki S M. J Physiol (London) 1978;277:193–226. - PMC - PubMed
    1. Newsome W T, Allman J M. J Comp Neurol. 1980;194:209–233. - PubMed

Publication types

LinkOut - more resources