. 1998 Jan;116(1):53-68.
doi: 10.1104/pp.116.1.53.

Studying early nodulin gene ENOD40 expression and induction by nodulation factor and cytokinin in transgenic alfalfa

Affiliations

Studying early nodulin gene ENOD40 expression and induction by nodulation factor and cytokinin in transgenic alfalfa

Y Fang et al. Plant Physiol. 1998 Jan.

Abstract

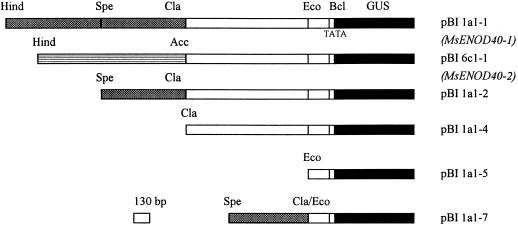
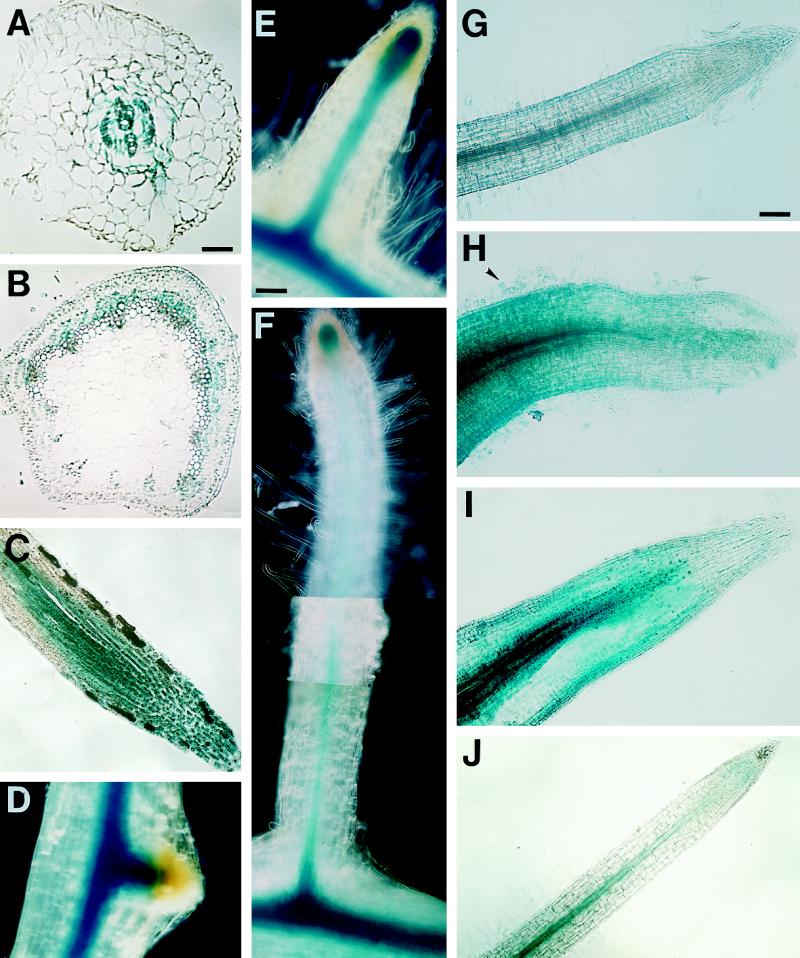
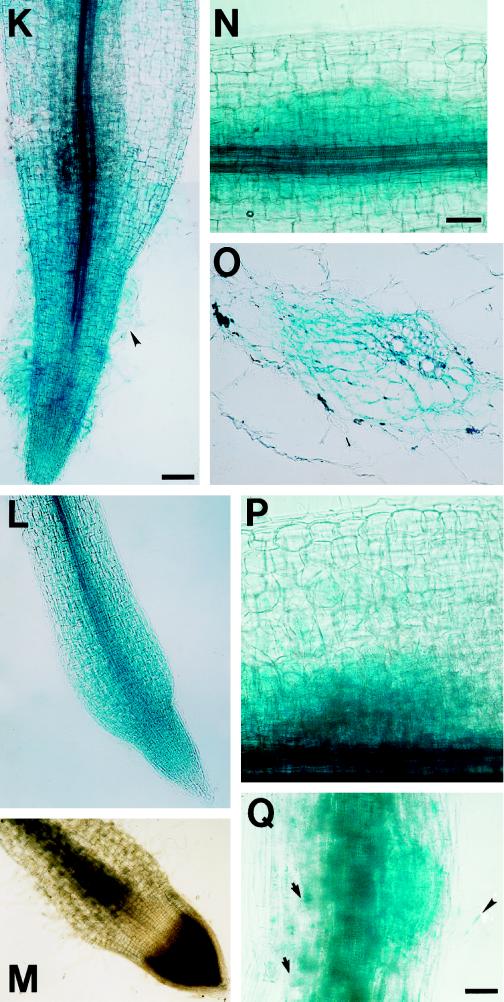
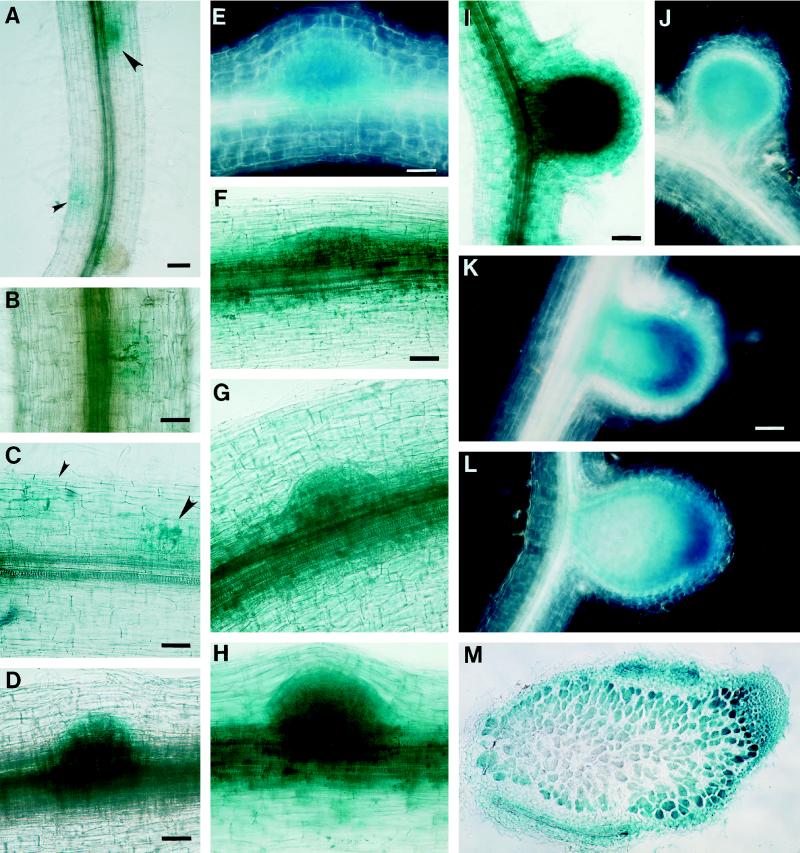
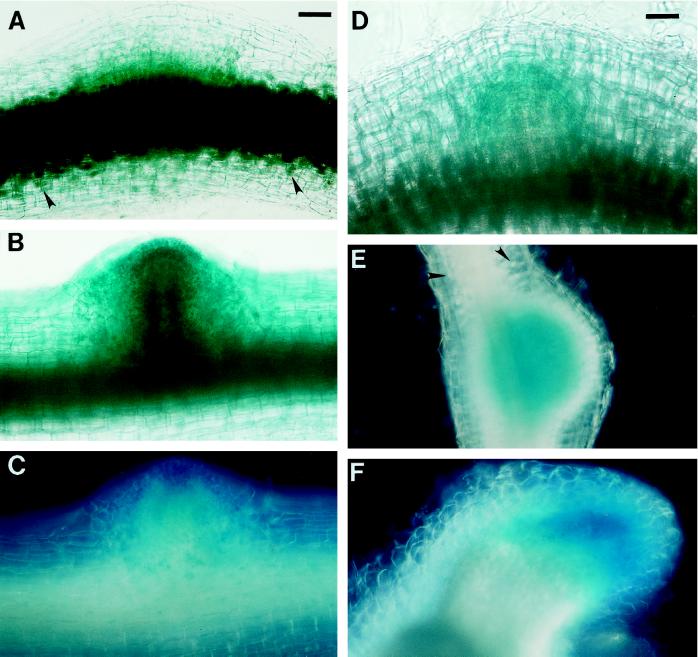
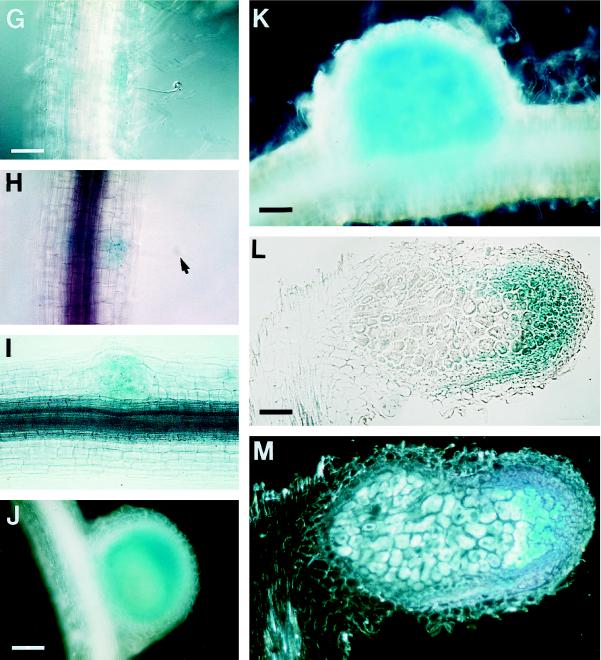
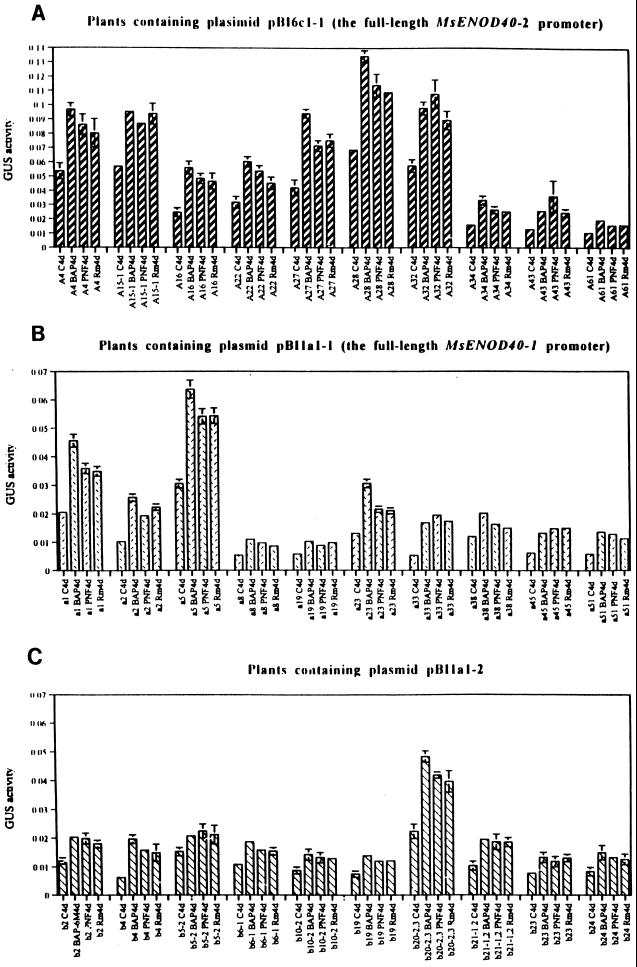
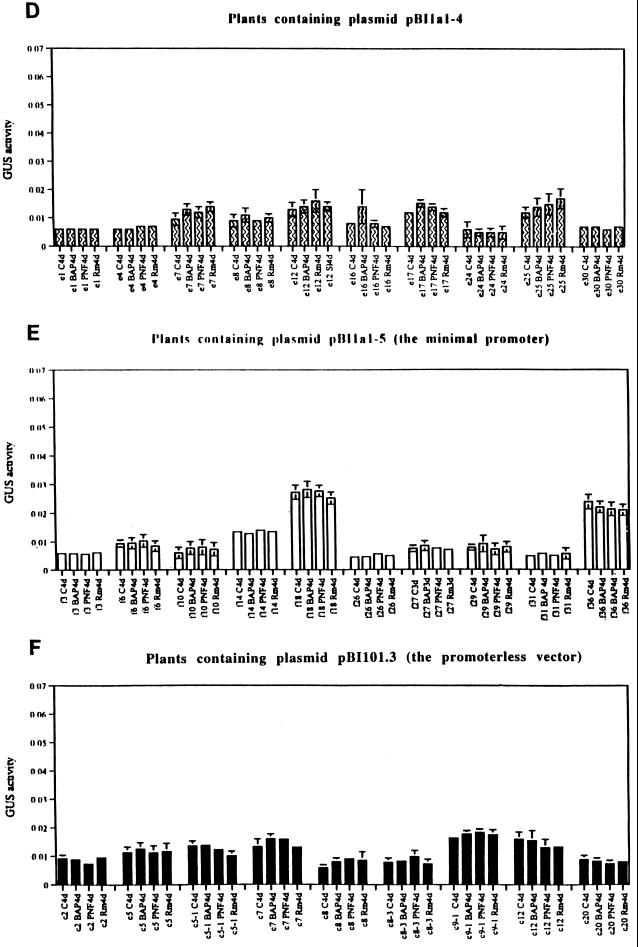
ENOD40, an early nodulin gene, is expressed following inoculation with Rhizobium meliloti or by adding R. meliloti-produced nodulation (Nod) factors or the plant hormone cytokinin to uninoculated roots. We isolated two MsENOD40 clones, designated MsENOD40-1 and MsENOD40-2, with distinct promoters from an alfalfa (Medicago sativa cv Chief) genomic library. The promoters were fused to the reporter gene uidA (gus), and the constructs were introduced into alfalfa. We observed that the MsENOD40-1 construct was expressed almost exclusively under symbiotic conditions. The MsENOD40-2 construct was transcribed under both symbiotic and nonsymbiotic conditions and in nonnodular and nodular tissues. Both MsENOD40 promoter-gus constructs were similarly expressed as nodules developed, and both were expressed in roots treated with 6-benzylaminopurine or purified Nod factor. However, no blue color was detected in nodule-like structures induced by the auxin transport inhibitor N-1-(naphthyl)phthalamic acid on roots of plants containing the MsENOD40-1 promoter construct, whereas pseudonodules from plants containing the MsENOD40-2 promoter construct stained blue. A 616-bp region at the distal 5' end of the promoter is important for proper spatial expression of MsENOD40 in nodules and also for Nod-factor and cytokinin-induced expression.


Figures

Figure 2
Figure 2
The diagram shows the restriction map of the constructs used for alfalfa transformation. The vector pBI101.3 is a promoterless construct and is not shown here. The black boxes represent the reporter gene uidA (gus). The unshaded boxes are the regions shared by both promoters. The hatched box is the upstream region in the MsENOD40–1 promoter that is only 40% similar to the lined region in the MsENOD40–2 promoter. Hind, HindIII; Spe, SpeI; Cla, ClaI; Eco, EcoRV; Bcl, BclI; Acc, AccI; and Bam, BamHI.
Figure 1
Figure 1
Comparison of the promoter sequences of MsENOD40–1 (top sequence) and MsENOD40–2 (bottom sequence). The lines between the two sequences represent the identical nucleotides between them. Sequence analyses were performed on a VAX/VMS computer using program GAP in the University of Wisconsin Genetics Computer Group software package. Note that the first 1431 bp (1–1431) of the 3′ end were identical between the two promoters, and they are at the proximal end of the promoters (the unshaded regions in Fig. 2). The remaining 5′ distal sequences are only 40% similar to each other. Approximately 200 bp of sequence of the 5′ end of MsENOD40–1 is not shown here, but the promoter sequence of MsENOD40–2 is complete. The bold letters indicate the HindIII restriction site. The single-underlined letters are the BclI site; and the double-underlined letters indicate the putative TATA box in the promoter. The boxed regions are the putative “nodule-specific motifs.”
Figure 1
Figure 1
Comparison of the promoter sequences of MsENOD40–1 (top sequence) and MsENOD40–2 (bottom sequence). The lines between the two sequences represent the identical nucleotides between them. Sequence analyses were performed on a VAX/VMS computer using program GAP in the University of Wisconsin Genetics Computer Group software package. Note that the first 1431 bp (1–1431) of the 3′ end were identical between the two promoters, and they are at the proximal end of the promoters (the unshaded regions in Fig. 2). The remaining 5′ distal sequences are only 40% similar to each other. Approximately 200 bp of sequence of the 5′ end of MsENOD40–1 is not shown here, but the promoter sequence of MsENOD40–2 is complete. The bold letters indicate the HindIII restriction site. The single-underlined letters are the BclI site; and the double-underlined letters indicate the putative TATA box in the promoter. The boxed regions are the putative “nodule-specific motifs.”
Figure 3
Figure 3
The localization of GUS protein in the transgenic alfalfa plants in the absence of R. meliloti. A, Transverse section of a root of plant line A27 (MsENOD40–2). Blue color was detected in the stele, in the pericycle, endodermis, and inner cortex; bar = 55 μm. B, Cross-section of a stem of plant line A17 (MsENOD40–2). Blue color is localized to the stem procambium and the protophloem; same magnification as in C. C, Longitudinal section of a root tip of plant line A17 (MsENOD40–2). Note that the blue staining is present even in the root cap; bar = 110 μm. D, Lateral root primordium on transgenic plant line A27 (MsENOD40–2) same magnification as in C. E and F, Elongated lateral roots on the same plant shown in D; bar = 110 μm. G, Root of plant line a18 (MsENOD40–1) without any treatment; bar = 110 μm. H, Root of plant line a18 4 d after treatment with 10−6 m BAP. I, Root of plant line a18 4 d after treatment with 10−8 m PNF. J, Root of plant line A27 (MsENOD40–2) without any treatment. H through J are the same magnification as in G. K, A 10−6 m BAP-treated root of line A27 after 4 d; bar = 110 μm. L, Root of line A27 treated with 10−8 m PNF for 4 d. M, Root of line A23 treated with 10−6 m 2,4-D for 4 d; no blue color is present. L and M are the same magnification as in K. N, Nodule primordium formed on plant line a18 (MsENOD40–1) after BAP treatment for 4 d; bar = 55 μm. O, Cross-section of a primordium in N that was induced by BAP. P, Primordium formed on plant line A27 (MsENOD40–2) after BAP treatment for 4 d. Same magnification as N. Q, Nodule primordium formed on plant line A27 (MsENOD40–2) following 4 d of PNF treatment; bar = 55 μm. Arrows indicate starch grains and the arrowhead points to a root hair that is out of the plane of section.
Figure 3
Figure 3
The localization of GUS protein in the transgenic alfalfa plants in the absence of R. meliloti. A, Transverse section of a root of plant line A27 (MsENOD40–2). Blue color was detected in the stele, in the pericycle, endodermis, and inner cortex; bar = 55 μm. B, Cross-section of a stem of plant line A17 (MsENOD40–2). Blue color is localized to the stem procambium and the protophloem; same magnification as in C. C, Longitudinal section of a root tip of plant line A17 (MsENOD40–2). Note that the blue staining is present even in the root cap; bar = 110 μm. D, Lateral root primordium on transgenic plant line A27 (MsENOD40–2) same magnification as in C. E and F, Elongated lateral roots on the same plant shown in D; bar = 110 μm. G, Root of plant line a18 (MsENOD40–1) without any treatment; bar = 110 μm. H, Root of plant line a18 4 d after treatment with 10−6 m BAP. I, Root of plant line a18 4 d after treatment with 10−8 m PNF. J, Root of plant line A27 (MsENOD40–2) without any treatment. H through J are the same magnification as in G. K, A 10−6 m BAP-treated root of line A27 after 4 d; bar = 110 μm. L, Root of line A27 treated with 10−8 m PNF for 4 d. M, Root of line A23 treated with 10−6 m 2,4-D for 4 d; no blue color is present. L and M are the same magnification as in K. N, Nodule primordium formed on plant line a18 (MsENOD40–1) after BAP treatment for 4 d; bar = 55 μm. O, Cross-section of a primordium in N that was induced by BAP. P, Primordium formed on plant line A27 (MsENOD40–2) after BAP treatment for 4 d. Same magnification as N. Q, Nodule primordium formed on plant line A27 (MsENOD40–2) following 4 d of PNF treatment; bar = 55 μm. Arrows indicate starch grains and the arrowhead points to a root hair that is out of the plane of section.
Figure 4
Figure 4
The localization of GUS protein during wild-type nodule development on roots of plants containing MsENOD40–1 and MsENOD40–2 promoter-gus constructs. The roots illustrated here were flood inoculated, but each developmental stage is comparable to that found by spot inoculation. Plants shown in A through E and J through M contained the MsENOD40–1 promoter construct. Plants shown in F through I contained the MsENOD40–2 promoter construct. A, Two areas showing the blue color on a root of plant line a18. The area indicated by the small arrowhead shows the blue color mainly in the outer cortical cells and the epidermis. The area indicated by the large arrowhead shows the blue color in the dividing inner cortical cells, including the pericycle; bar = 114 μm. B, An enlargement of the area indicated by the large arrowhead in A; bar = 57 μm. C, Two adjacent areas show the blue color on a root of plant line a33 at two stages similar to A; bar = 55 μm. D, A small nodule primordium on a root of plant line a18 (cell divisions in the inner cortical cells). The blue staining of GUS protein is displayed mainly in the inner cortical cells and its derivatives as well as in the root pericycle; bar = 110 μm. E, A well-developed nodule primordium on a root of plant line a33. Same magnification as in D. F through I, Nodule primordia/nodules at different developmental stages for MsENOD40–2 transgenic plants. The blue staining for GUS protein is present in the cortex, as well as in the root stele. F was from plant line A4, whereas G through I were from plant line A27. F, Bar = 55 μm. G is the same magnification as B. H is the same magnification as F. I, Bar = 110 μm. J through L, Nodules at different stages (postprimordium) on plant line a18 or a33. J is the same magnification as I. K, Bar = 110 μm. M, Longitudinal section of a mature nodule on plant line b5–2 (containing construct pBI1a1–2). L and M are the same magnification as K. Note that the blue color is present in the nodule meristem, in peripheral infected cells, and in cells associated with the nodule vascular bundles.
Figure 5
Figure 5
GUS localization during the development of ineffective nodules (A through F) and during nodule formation on plants containing the composite promoter in pBI1a1–7 (see Fig. 2; plants with the composite promoter are represented by the letter H). A through C represent different stages of nodules induced by 10−5 m NPA on plants containing the MsENOD40–2 promoter construct (seven different lines were examined). The blue color is not only found in the nodule primordium, but also in the root cortex. A, Very young nodule primordium on plant line A27. Arrowheads indicate starch grains. B, NPA-induced nodule on plant line A32. C, Dark-field picture of B. D through F show the different stages of R. meliloti exo (strain 7094) mutant-induced nodule development (eight different lines were examined). D, Nodule primordium on plant line a18 (MsENOD40–1); bar = 55 μm. E, Well-formed nodule primordium on plant line a18 (MsENOD40–1). Arrowheads indicate starch grains. F, Mature exo nodule on plant line A27. The blue color is mainly located in the apical and peripheral area of the nodule. A through C and E through F are the same magnification; bar = 110 μm. G, An infection thread formed in a curled root hair on plant line H2. The picture was taken with Nomarski optics; bar = 92 μm. H, Bright-field picture of G, showing the blue color in the cortical cells where the infection thread has penetrated. The arrow indicates the curled root hair. I, Very young nodule primordium on plant line H35. Same magnification as A. J, Nodule primordium on plant line H2; bar = 55 μm. K, Young nodule on plant line H15; bar = 460 μm. L, Section of a mature nodule formed on plant line H25; bar = 110 μm. M, Dark-field picture of L.
Figure 5
Figure 5
GUS localization during the development of ineffective nodules (A through F) and during nodule formation on plants containing the composite promoter in pBI1a1–7 (see Fig. 2; plants with the composite promoter are represented by the letter H). A through C represent different stages of nodules induced by 10−5 m NPA on plants containing the MsENOD40–2 promoter construct (seven different lines were examined). The blue color is not only found in the nodule primordium, but also in the root cortex. A, Very young nodule primordium on plant line A27. Arrowheads indicate starch grains. B, NPA-induced nodule on plant line A32. C, Dark-field picture of B. D through F show the different stages of R. meliloti exo (strain 7094) mutant-induced nodule development (eight different lines were examined). D, Nodule primordium on plant line a18 (MsENOD40–1); bar = 55 μm. E, Well-formed nodule primordium on plant line a18 (MsENOD40–1). Arrowheads indicate starch grains. F, Mature exo nodule on plant line A27. The blue color is mainly located in the apical and peripheral area of the nodule. A through C and E through F are the same magnification; bar = 110 μm. G, An infection thread formed in a curled root hair on plant line H2. The picture was taken with Nomarski optics; bar = 92 μm. H, Bright-field picture of G, showing the blue color in the cortical cells where the infection thread has penetrated. The arrow indicates the curled root hair. I, Very young nodule primordium on plant line H35. Same magnification as A. J, Nodule primordium on plant line H2; bar = 55 μm. K, Young nodule on plant line H15; bar = 460 μm. L, Section of a mature nodule formed on plant line H25; bar = 110 μm. M, Dark-field picture of L.
Figure 6
Figure 6
The results of GUS colorimetric assays in the transgenic alfalfa roots. A, Plants with construct pBI6c1–1. B, Plants with construct pBI1a1–1. C, Plants with construct pBI1a1–2. D, Plants with construct pBI1a1–4. E, Plants with construct pBI1a1–5. F, Plants with vector pBI101.3. GUS activity is expressed as per milligram per hour per milliliter. Plants containing the same construct are represented with the same letter, e.g. letter “A” for construct pBI6c1–1, “a” for pBI1a1–1, “b” for pBI1a1–2, “c” for pBI101.3, “e” for pBI1a1–4, and “f” for pBI1a1–5. The number following the letter represents an individual plant line; a different number represents a different transgenic plant. Plant roots were harvested after a 4-d treatment with the following: C, Jensen's medium only; 10−6 m BAP; 10−8 m PNF; Rm, wild-type R. meliloti strain 1021. The line above and below the average values represent the sd. If absent, the sds were too small to be displayed.
Figure 6
Figure 6
The results of GUS colorimetric assays in the transgenic alfalfa roots. A, Plants with construct pBI6c1–1. B, Plants with construct pBI1a1–1. C, Plants with construct pBI1a1–2. D, Plants with construct pBI1a1–4. E, Plants with construct pBI1a1–5. F, Plants with vector pBI101.3. GUS activity is expressed as per milligram per hour per milliliter. Plants containing the same construct are represented with the same letter, e.g. letter “A” for construct pBI6c1–1, “a” for pBI1a1–1, “b” for pBI1a1–2, “c” for pBI101.3, “e” for pBI1a1–4, and “f” for pBI1a1–5. The number following the letter represents an individual plant line; a different number represents a different transgenic plant. Plant roots were harvested after a 4-d treatment with the following: C, Jensen's medium only; 10−6 m BAP; 10−8 m PNF; Rm, wild-type R. meliloti strain 1021. The line above and below the average values represent the sd. If absent, the sds were too small to be displayed.

References

    1. Asad S, Fang Y, Wycoff KL, Hirsch AM. Isolation and characterization of cDNA and genomic clones of MsENOD40: transcripts are detected in meristematic cells of alfalfa. Protoplasma. 1994;183:10–23.
    1. Bak Ramlov K, Bech Laursen N, Stougaard J, Marcker KA. Site-directed mutagenesis of the organ-specific element in the soybean leghaemobloin lbc3 gene promoter. Plant J. 1993;4:577–580. - PubMed
    1. Bauer P, Crespi MD, Szecsi J, Allison LA, Schultze M, Ratet P, Kondorosi E. Alfalfa Enod12 genes are differentially regulated during nodule development by Nod factors and Rhizobium invasion. Plant Physiol. 1994;105:585–592. - PMC - PubMed
    1. Bauer P, Ratet P, Crespi MD, Schultze M, Kondorosi A. Nod factors and cytokinins induce similar cortical cell division, amyloplast deposition and Msenod12A expression in alfalfa roots. Plant J. 1996;10:91–105.
    1. Beaty JS, Powell GK, Licia L, Rigier DA, MacDonald EMS, Hommes NG, Morris RO. Tzs, a nopaline Ti plasmid gene from Agrobacterium tumefaciens associated with trans-zeatin biosynthesis. Mol Gen Genet. 1986;203:274–280.

Publication types

MeSH terms

Associated data

LinkOut - more resources